Designing an LLM Evaluation and Observability Platform like LangSmith or Braintrust
When I design an evaluation and observability platform for LLM applications, in the spirit of LangSmith or Braintrust, I start from an uncomfortable fact: the customer's product is non-deterministic, and the bugs that matter most do not throw exceptions. An agent that confidently calls the wrong tool, a retrieval step that returns a stale document, a prompt change that makes answers 30% longer and slightly worse: none of these show up in a classic APM dashboard. The only way to see them is to capture what the model actually saw and said, and then score it.
That makes the platform two systems glued together. One is a high-volume telemetry pipeline that looks a lot like distributed tracing, except that every span may carry tens of kilobytes of prompt and completion text. The other is an evaluation engine that runs models against datasets, grades outputs (often with another model), and turns those grades into decisions: ship this prompt, roll back that model, page someone because quality is drifting. The telemetry side has to be cheap and never slow down the customer. The evaluation side has to be trustworthy, because a release gate that people do not believe gets switched off.
In this post I walk through how I would build this platform as a multi-tenant SaaS. I cover scoping, requirements with capacity estimates, a high-level architecture, and then four deep-dives:
- Trace capture for LLM and agent calls
- Offline evaluation with datasets and LLM-as-judge
- Online evaluation, drift detection and regression gates
- Cost and latency analytics at scale
Scoping the Problem and Clarifying Assumptions
I am building a hosted product that thousands of customer teams point their LLM applications at. They install an SDK (or send OpenTelemetry data), see their traces in a web console, build datasets, run experiments, and wire quality checks into CI.
What I'm including:
- Trace ingestion from SDKs and OpenTelemetry-style exporters, for single LLM calls and nested agent runs
- Storage and search over traces, with a tree view of every step
- Versioned datasets and offline experiments that score prompt or model variants
- Online scoring of live traffic, user feedback, drift alerts and CI regression gates
- Token, cost and latency analytics per feature, user and model
What I'm NOT building here:
- The LLM gateway or inference fleet itself. The customer's app calls its model provider directly, and I only observe. (I do call models for judging, but as a client.)
- A general-purpose log or metrics product. I store LLM-shaped spans, not arbitrary application logs.
- Prompt management and agent orchestration. I link prompt versions to traces, but the runtime is the customer's.
Key assumptions:
- About 5,000 customer teams, with a heavy tail: a few large tenants send a large share of the volume
- About 5 billion spans per day across all tenants
- Roughly 40% of spans are LLM calls carrying full prompts and completions. The rest are tool calls, retrieval steps and chain or agent wrapper spans with small payloads.
- Default retention of 30 days for full traces, longer for aggregates and for anything a customer pins into a dataset
- Customers care a lot about data handling: many will require PII redaction, region pinning, or both
How this differs from classic tracing: a normal distributed tracing system stores spans that are a few hundred bytes of attributes, and it is fine to sample 1% of them because most traces look alike. Here the payload is the point. The prompt text, the retrieved chunks and the completion are what an engineer needs to debug a bad answer, and they are 10 to 100 times larger than the span metadata. Sampling is also harder, because the interesting traces (the bad answers) are rare and do not look different from the good ones until something scores them. And the platform is not passive: it runs its own model calls to grade outputs, which has a real per-trace cost.
Functional and Non-Functional Requirements
Functional Requirements
- Ingest: accept batched spans from SDKs and OTLP exporters and assemble them into traces.
- Explore: filter traces by project, time, tags, model, latency, cost or score, search their text, and render any trace as a tree.
- Datasets: versioned datasets from traces or uploads, with optional references and human labels.
- Experiments: run variants (prompt, model, parameters, agent build) over a dataset and score each row.
- Online scoring: score a sampled, budgeted share of live traces asynchronously.
- Feedback: accept end-user feedback and join it to traces.
- Gates and alerts: pass or fail a CI check against a baseline; alert on score drops or drift.
- Analytics: tokens, cost and latency percentiles by any tag.
Non-Functional Requirements
| Requirement | Target | Why |
|---|---|---|
| SDK overhead | no blocking on the request path; bounded memory | The customer's app must never be slower because of me |
| Ingest availability | 99.95%, with SDK-side buffering for blips | Lost traces are lost forever |
| Ingest-to-query freshness | p95 under 30 s | Engineers debug while reproducing |
| Trace list query | p95 under 2 s for 7-day windows | The console is an interactive tool |
| Analytics query | p95 under 3 s on rollups, slower allowed for raw scans | Dashboards over billions of spans |
| Tenant isolation | no cross-tenant reads; one tenant's spike cannot stall others | Multi-tenant SaaS with sensitive data |
| Eval reproducibility | same dataset version, same scorer version, same result within noise | A gate people trust |
Back-of-the-Envelope Capacity Estimation
These are my planning assumptions, not measurements. The method matters more than the exact numbers.
Span rate:
- 5B spans / 86,400 s ≈ 58,000 spans per second on average
- Peak at 3x ≈ 175,000 spans per second, and a single large tenant can spike far above its own average during a backfill or load test
Payload size:
- An LLM span with history and retrieved context: I assume about 3,000 tokens of text, around 12 KB
- Other spans: about 1 KB
- Weighted average: 0.4 × 12 KB + 0.6 × 1 KB ≈ 5 KB per span
Ingest bandwidth and storage:
raw ingest      = 5e9 spans x 5 KB        = 25 TB / day
                = 25 TB / 86,400 s        ≈ 290 MB/s average, ~870 MB/s peak
payload stored  = 25 TB / 5 (zstd, assumed) ≈ 5 TB / day
30-day payloads ≈ 150 TB in object storage
metadata        = ~400 B raw per span, ~8x columnar compression ≈ 50 B
                = 5e9 x 50 B              ≈ 250 GB / day, ~7.5 TB for 30 days
The split is the key insight: metadata is small enough for a fast columnar database, payloads are big enough that only object storage makes sense. If I put prompts and completions in the columnar store, I multiply the expensive tier by twenty.
Object counts: 5 billion tiny objects per day would make object storage request costs dominate. So I never write one object per span. Processors pack payloads into segment files (one per tenant partition, flushed every 30 seconds or 64 MB), and each span row stores a pointer: object key, byte offset and length. Reading a trace becomes a few byte-range GETs.
Online evaluation cost: with about 10 spans per trace, that is roughly 500 million traces per day. If every tenant scored 1% of traces with an LLM judge at about 2,500 tokens per call, that is 5 million judge calls and 12.5 billion judge tokens per day. That is a large model bill. Online scoring has to be opt-in, sampled and budgeted per tenant, which shapes the third deep-dive.
High-Level Architecture and Core Components
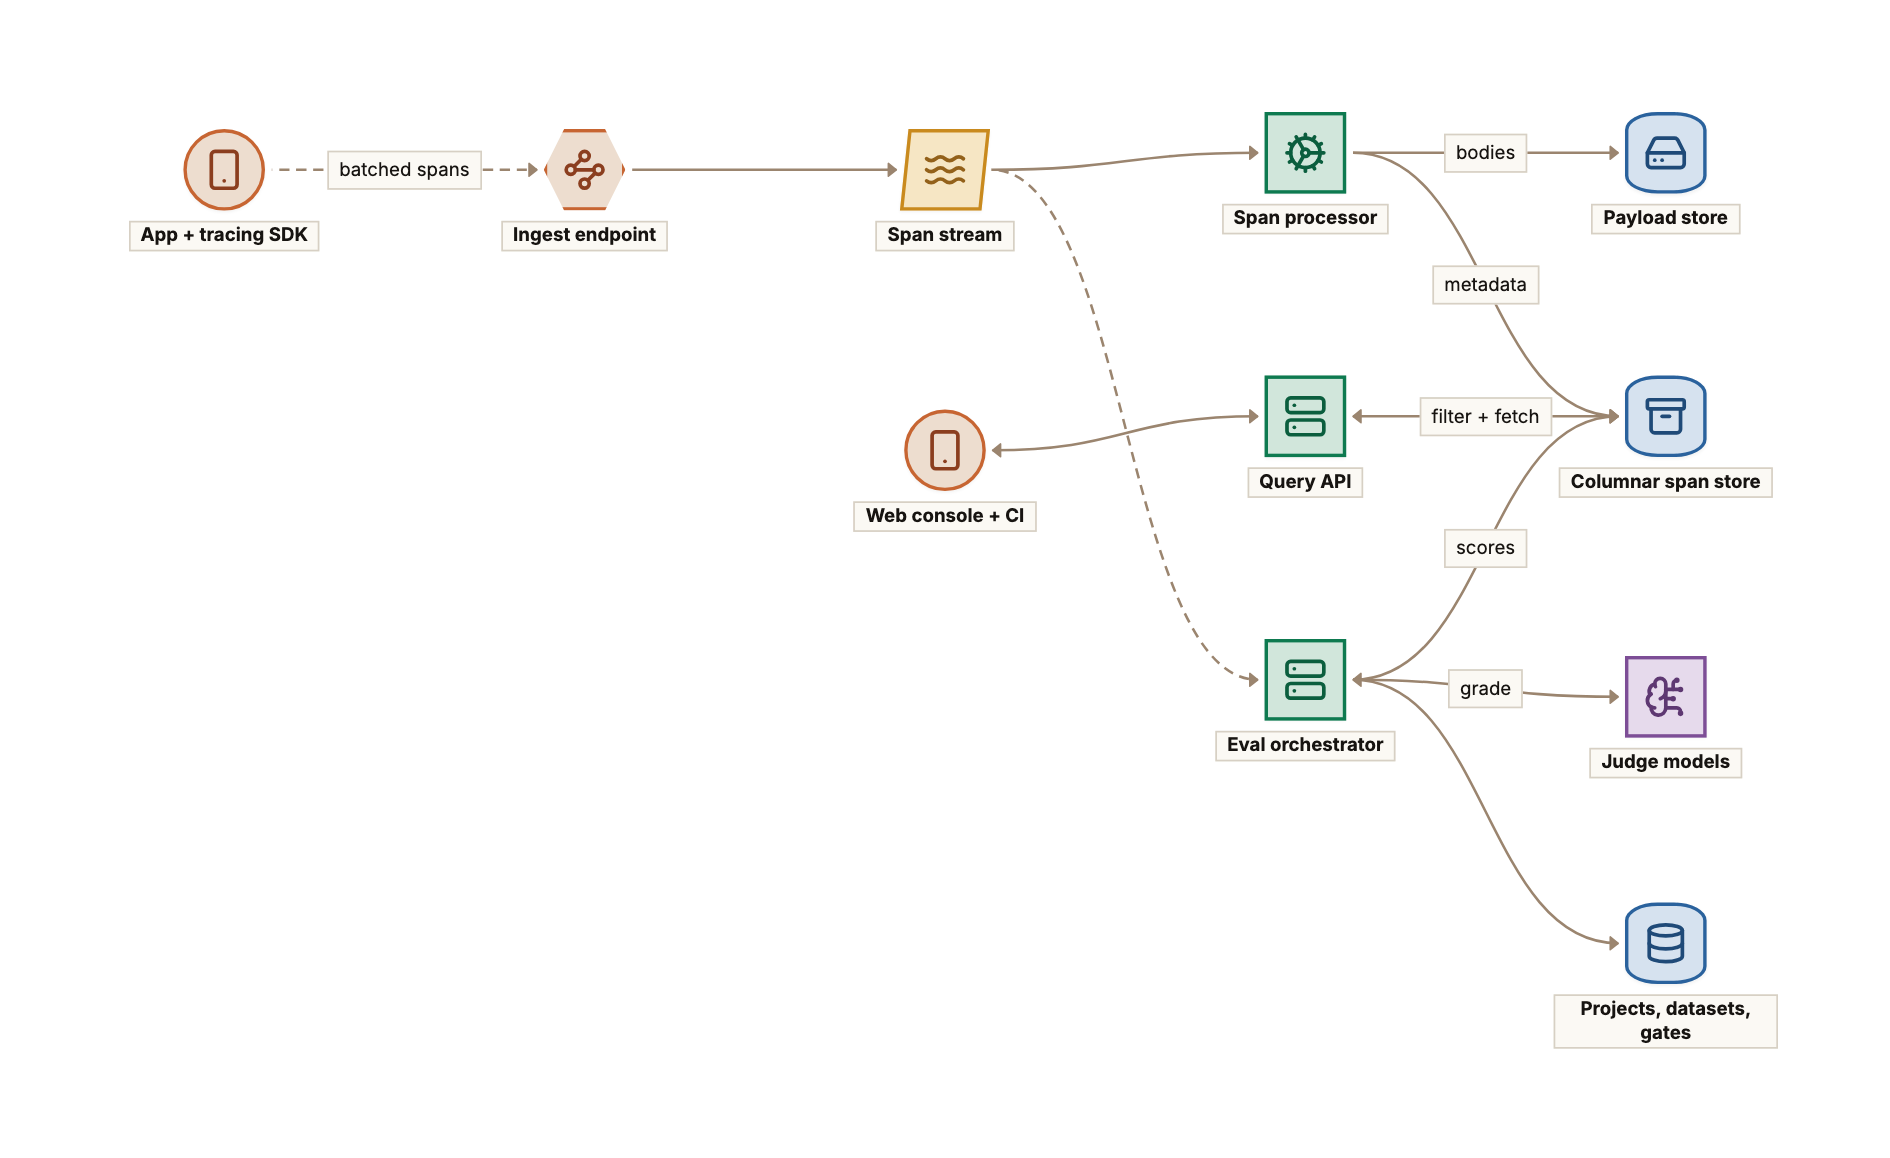
Component Walkthrough
Tracing SDK. Python and TypeScript libraries plus an OTLP endpoint for anything else. It wraps model clients and agent frameworks, buffers spans in memory and ships compressed batches in the background. Covered in the first deep-dive.
Ingest endpoint. A stateless HTTP service that authenticates the API key, resolves tenant and project, checks ingest quota and writes the batch to the stream. It returns 202 Accepted once the write is durable and does no heavy work.
Span stream. A log such as Kafka, partitioned by tenant and project, so one tenant's burst lands on a bounded set of partitions. If the columnar store is slow, the stream absorbs the backlog instead of the ingest tier failing.
Span processor. Consumers that validate, redact, compute derived fields (cost, duration), and split payloads from metadata before writing each to its store.
Columnar span store. ClickHouse or a similar engine. "Filter billions of rows by a few columns, then aggregate" is exactly what trace lists and analytics need. Rows are ordered by tenant, project and time so every query prunes to a narrow range.
Payload store. Object storage holding compressed segment files, with a small read-through cache because people open the same trace repeatedly while debugging.
Eval orchestrator. Owns datasets, experiments, scorers, online scoring rules and gates. It schedules scoring work onto a worker fleet and writes scores back as their own rows keyed by trace and span id.
Judge models. External providers or a self-hosted model for model-graded scorers, billed to the tenant and behind their own rate limiter.
Metadata database. Postgres for tenants, projects, keys, dataset versions, experiment configs and gates. Never spans.
Query API. Turns console queries into tenant-scoped columnar SQL, fetches payloads by pointer for the traces on screen, and enforces per-tenant query limits.
Request Flow
- The customer's agent handles a user request. The SDK opens a root span, then child spans for each LLM call, tool call and retrieval, and records inputs, outputs, tokens and timings in memory.
- A background flusher sends a gzip batch of finished spans to
POST /v1/spansevery second or every 500 spans. - The ingest endpoint authenticates, checks quota, appends the batch to the stream and returns
202. - A processor consumes the batch, redacts, writes payloads to a segment file, and inserts metadata rows with payload pointers.
- Within about 30 seconds the trace appears in the console. If an online scoring rule matches and the sampler picks it, a scoring task is queued once the trace is complete.
- An engineer filters by "score below 0.5 in the last hour", opens a trace, and adds it to a regression dataset with one click.
Scaling It Out
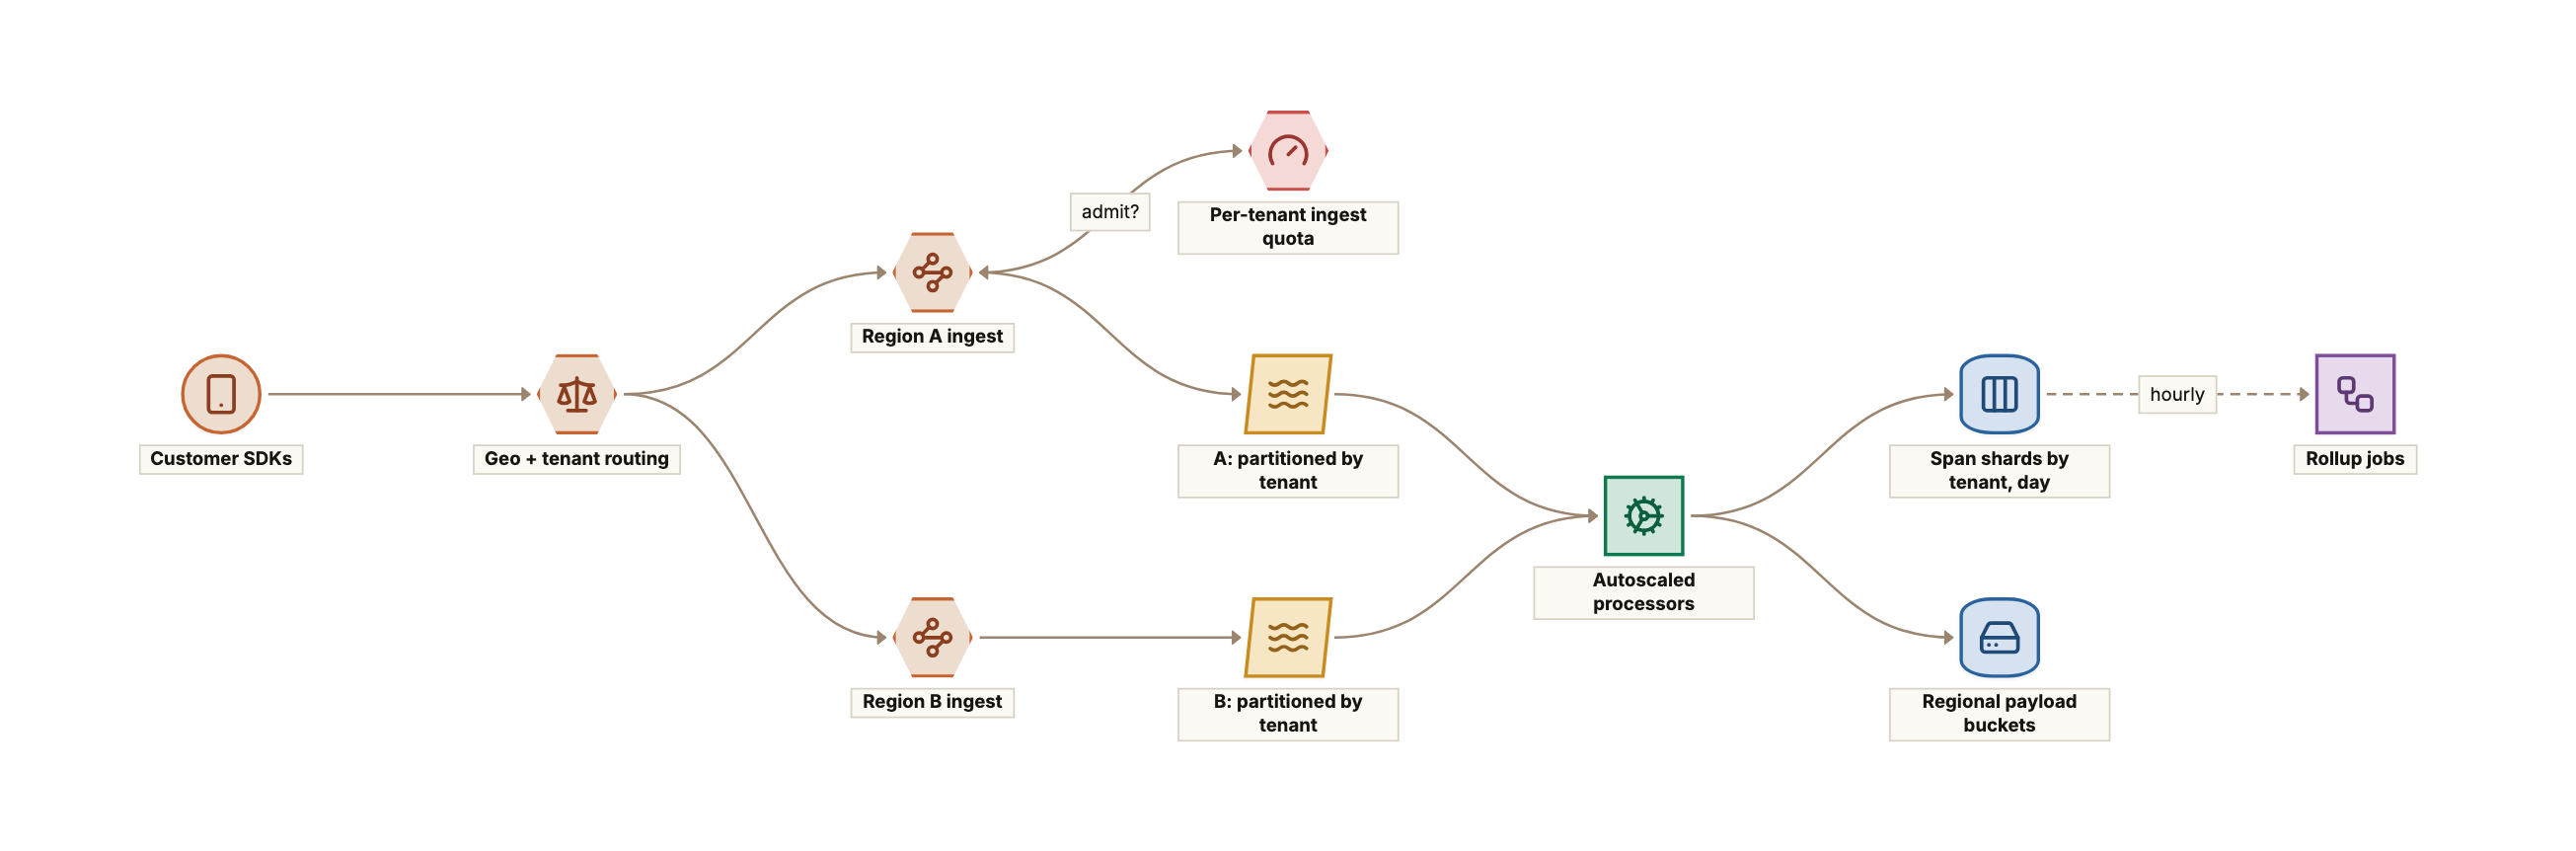
- Regions as data boundaries. Each region is a full cell (ingest, stream, processors, stores), and a tenant is homed in one, because many customers require data residency.
- Partitioning by tenant in both the stream and the columnar store, with large tenants spread across shards by trace id hash.
- Autoscale processors on consumer lag, not CPU. Lag is the freshness SLO.
- Ingest quota at the edge in spans and bytes per second. Bursts get
429with a retry hint, and the SDK buffers. One tenant's runaway loop cannot flood the shared stream.
Deep-Dive: Trace Capture for LLM and Agent Calls
The Span Model
I keep the OpenTelemetry shape (trace id, span id, parent id, times, attributes, status) because customers already have OTel exporters, and the emerging GenAI semantic conventions name common attributes such as model and token counts. On top I add typed span kinds: llm (model, parameters, messages, output, tokens, TTFT), tool (arguments and result), retrieval (query, documents, scores), chain/agent wrappers, and score rows attached later.
An agent run is a tree: a root agent span with dozens of children, including tool calls that themselves call models. The tree is what makes debugging possible: "the second retrieval returned nothing, and the model made something up instead of saying so."
{
  "trace_id": "7f3a9c...",
  "span_id": "b21e...",
  "parent_span_id": "a90d...",
  "project_id": "support-bot",
  "kind": "llm",
  "name": "draft_answer",
  "start_time": "2026-10-21T09:14:02.118Z",
  "end_time": "2026-10-21T09:14:04.903Z",
  "attributes": {
    "model": "provider/model-large-2026-09",
    "prompt_version": "answer-v14",
    "input_tokens": 3120,
    "cached_tokens": 2048,
    "output_tokens": 412,
    "ttft_ms": 640,
    "user_id_hash": "u_9c1f...",
    "feature": "refund_flow"
  },
  "input": {"messages": ["..."]},
  "output": {"content": "..."},
  "status": "ok"
}
Spans are immutable once ended, but a trace arrives in pieces and out of order, sometimes from several services. The processor writes spans as they come, and a trace is marked "settled" when its root has ended and nothing new has arrived for a quiet period (say 60 seconds). Online scoring waits for that signal.
SDK Design: Never Block the Customer
This is the most important rule in the system. If my SDK adds latency, or crashes the app when ingest is down, customers will rip it out. So:
- Record in memory, ship in the background, in gzip batches of 500 spans or every second, whichever comes first.
- Bounded memory, drop-oldest. If ingest is down for minutes, drop the oldest spans and report the drop count, so the console shows the gap instead of silently missing data.
- Retry with backoff and jitter on
429and5xx, respectingRetry-After. - Flush on shutdown. Serverless functions freeze right after returning, so the SDK exposes
flush()and registers exit hooks. - Fail open. A bug in tracing must never become a bug in the customer's product.
class SpanExporter:
    def __init__(self, client, max_queue=10_000, max_batch=500, interval_s=1.0):
        self.q = collections.deque(maxlen=max_queue)   # drop-oldest when full
        self.dropped = 0
        self.client, self.max_batch, self.interval_s = client, max_batch, interval_s
        threading.Thread(target=self._run, daemon=True).start()

    def export(self, span):                            # called on the hot path
        if len(self.q) == self.q.maxlen:
            self.dropped += 1
        self.q.append(span)                            # O(1), never blocks

    def _run(self):
        while True:
            time.sleep(self.interval_s)
            while self.q:
                batch = [self.q.popleft() for _ in range(min(self.max_batch, len(self.q)))]
                try:
                    self.client.post_gzip("/v1/spans", batch, dropped=self.dropped)
                except RetryableError as e:
                    time.sleep(e.backoff_s)            # jittered; keep remaining spans
                except Exception:
                    pass                               # fail open, never raise into the app
Sampling
For LLM apps I default to keeping everything, because most tenants' volumes are modest and bad traces are rare and valuable. For the large tenants, I offer:
- Head sampling by rate, decided at the root and propagated to children so traces are never half-kept
- Rules that always keep errors, traces with user feedback, traces above a latency or cost threshold, and traces from flagged users or features
- Payload sampling as a middle ground: keep 100% of metadata (so cost and latency analytics stay exact) but keep full prompt and completion bodies for only a fraction. This cuts the expensive part of storage while keeping dashboards correct.
Tail sampling (decide after the whole trace is seen) fits naturally server-side, since I already wait for traces to settle. I would add it later.
Payload Size and PII
Prompts can be huge: long contexts, base64 images, whole documents. My rules:
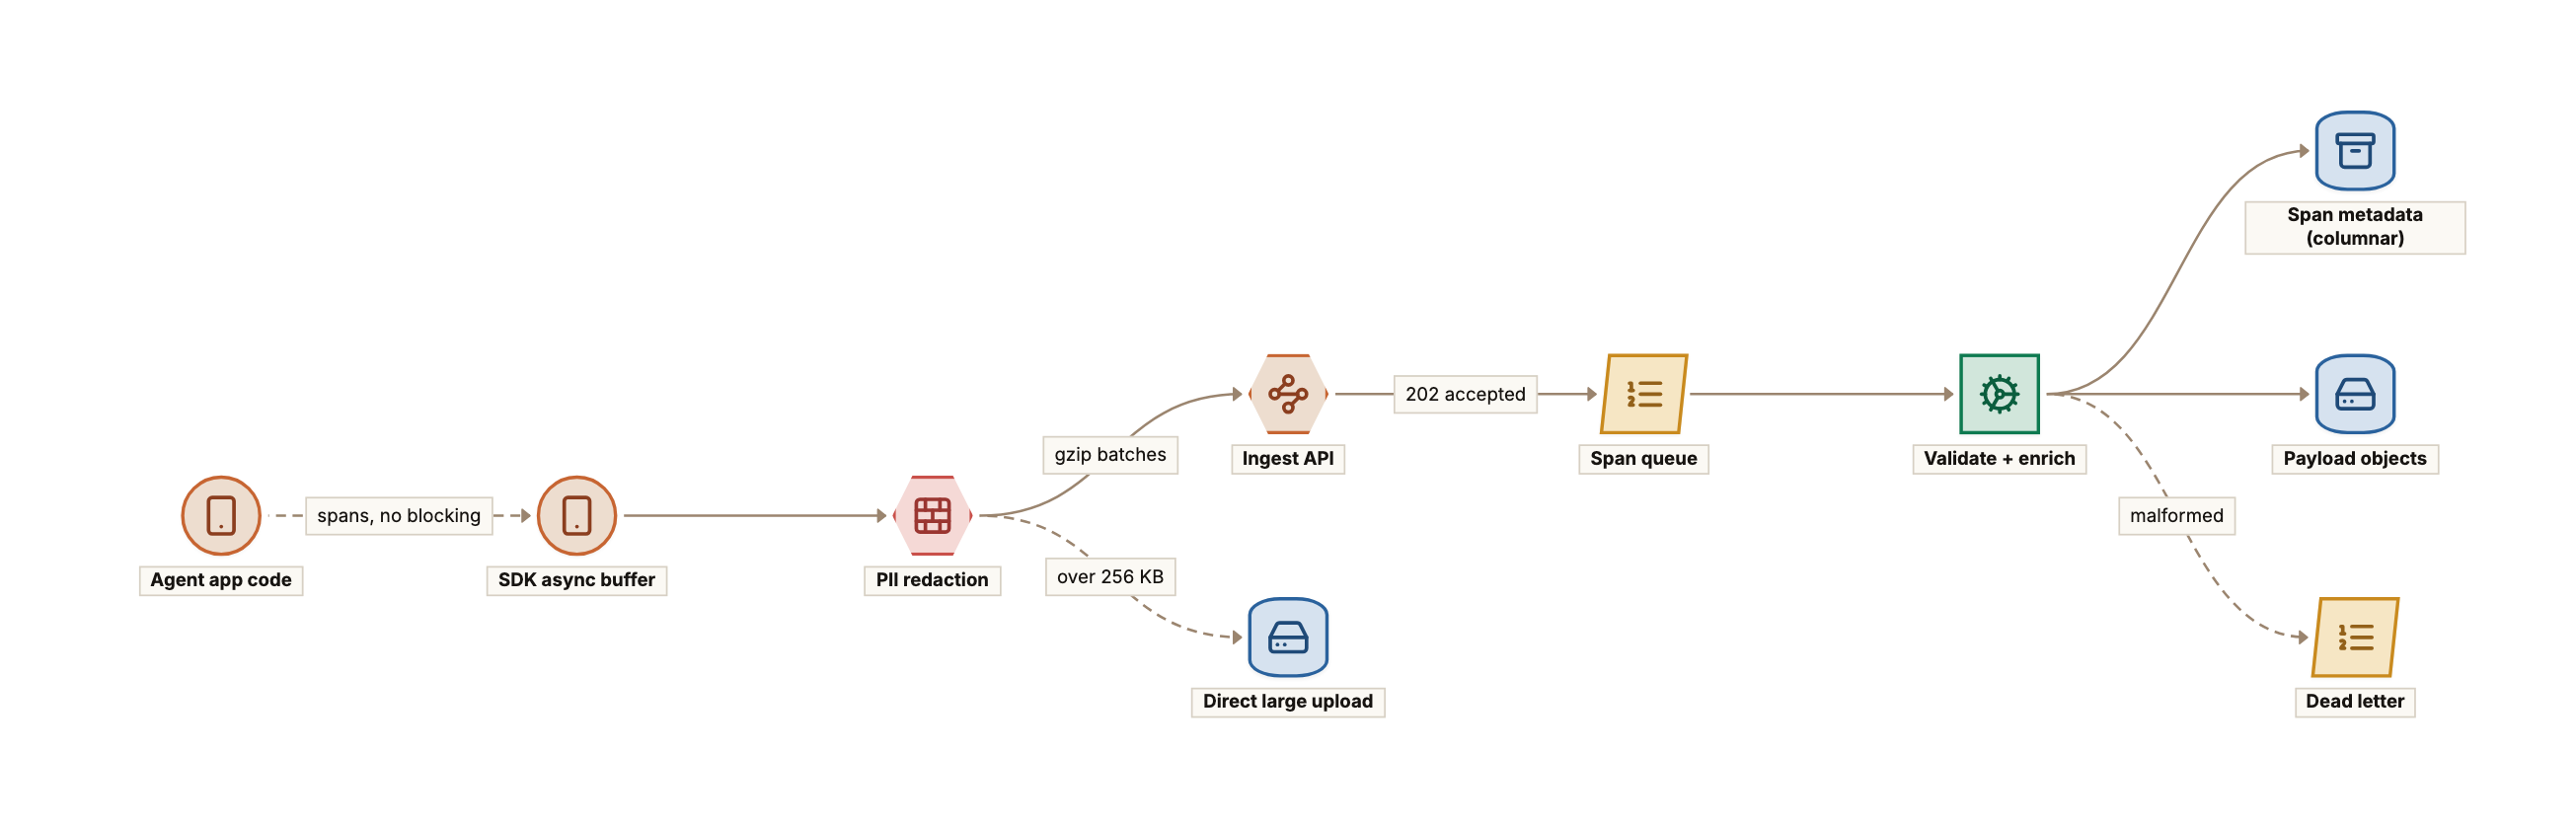
- Inline limit. Payloads up to about 256 KB ride in the batch. Larger bodies go straight to object storage through a presigned URL, and the span carries a reference.
- Hard cap and truncation with a clear marker, for runaway loops.
- Redaction in two places. Client-side regex and customer hooks keep emails, card numbers and custom IDs inside the customer's network; per-project server rules catch the rest. A "metadata only" mode sends no bodies at all.
- Hash identifiers with a per-tenant salt, so analytics can group by user without knowing who they are.
The Ingest Pipeline and Storage Split
The processor is where the storage split happens. For each batch it:
- Validates the schema and sends malformed spans to a dead-letter queue, with samples shown in the console
- Applies server-side redaction
- Appends payloads to the open segment file for that tenant partition, recording offset and length
- Builds metadata rows with the payload pointer and a short preview of input and output for list views
- Inserts rows in large batches, because columnar engines hate tiny inserts
- Commits the stream offset only after both writes succeed
Because of step 6, a crash replays the batch. Writes are idempotent on (tenant, span_id), using a table engine that deduplicates on merge, plus a query-time dedup for the window before merges happen.
Full-text search over every prompt in an inverted index would cost more than the rest of storage. I start with token bloom-filter skip indexes on the preview columns, which handle "traces mentioning refund" within a time range. Tenants who need search over full bodies get an asynchronous per-tenant index as a paid add-on.
What I would do first vs later: first, the SDK with batching, the OTLP endpoint, the stream, and the metadata/payload split. Later, tail sampling, per-tenant full-text indexes and payload deduplication (many prompts share the same long system prompt, which could be stored once by content hash).
Deep-Dive: Offline Evaluation: Datasets and LLM-as-Judge
Datasets From Production
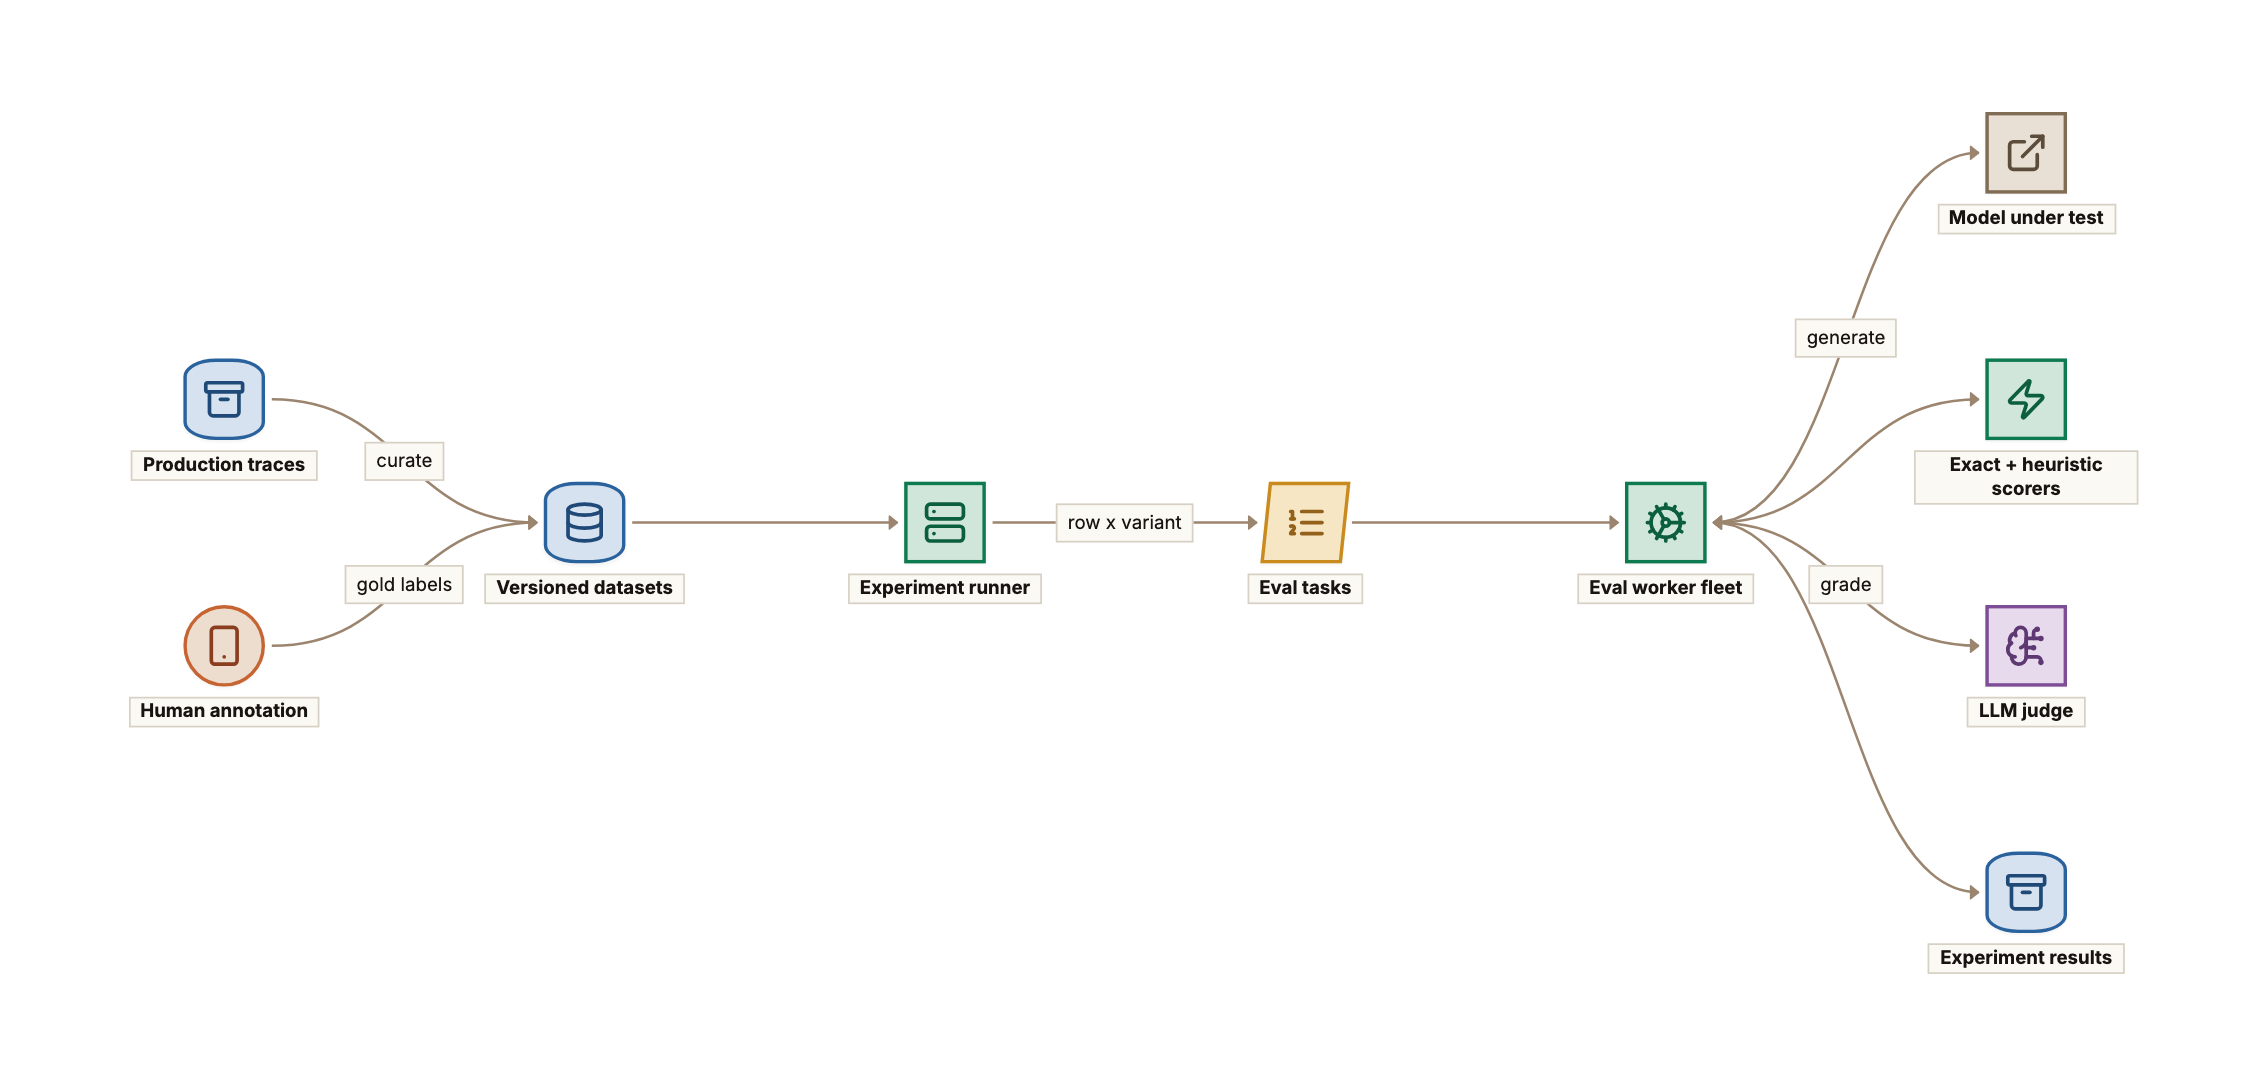
The best eval datasets come from real traffic, because synthetic examples miss what users actually do. The workflow starts in the trace explorer: filter for negative feedback or low online scores, review, and add to a dataset. Each row stores the input (optionally with frozen retrieved context), an optional reference output, and tags.
Datasets are versioned and immutable per version. An experiment records which dataset version it ran against. Without this, "the new prompt scores 4 points higher" is meaningless, because someone may have deleted the hard rows in between. Rows are stored as JSON in object storage with a manifest in Postgres listing the row ids per version, so creating a new version that adds 20 rows does not copy 10,000.
Experiments
An experiment is a grid of dataset rows × variants × scorers. The runner expands it into one task per row per variant and queues them with a concurrency limit. Workers call the model under test with the customer's encrypted provider key, record the run as ordinary traces (so a bad row is debugged with the production trace view), run each scorer, and write (experiment_id, row_id, variant, scorer, score, rationale) rows.
Scorers: From Cheap and Exact to Expensive and Fuzzy
I order scorers by cost and trust:
| Scorer type | Examples | Cost | Trust |
|---|---|---|---|
| Exact | exact match, JSON schema valid, correct tool selected, SQL returns the expected rows | near zero | high, when applicable |
| Heuristic | regex checks, length limits, embedding similarity to reference, citation present | low | medium |
| Model-graded | "is this answer faithful to the retrieved context?", rubric scoring, pairwise preference | high | depends on calibration |
The defaults push customers to use exact checks wherever the task allows and reserve model-graded scorers for qualities that need judgement, such as faithfulness and tone.
LLM-as-Judge and Its Pitfalls
Model-graded evaluation is powerful and easy to get wrong. The paper "Judging LLM-as-a-Judge" (the MT-Bench and Chatbot Arena work) documented several biases that I design around:
- Position bias. Pairwise judges tend to favour one slot. I run every comparison in both orders and count a win only when both agree; otherwise it is a tie.
- Verbosity bias. Judges tend to prefer longer answers. Rubric instructions help a little, so I also show the length difference next to every score, making a "win" that is really "30% longer" visible.
- Self-preference. A judge may favour its own model family, so when comparing models I use a judge from another family, or several.
- Rubric vagueness. "Rate quality 1 to 10" is noisy. Narrow binary questions ("does the answer make a claim the context does not support?") are far more stable.
Calibration Against Human Labels
A judge is a model, and I evaluate it like one. For each model-graded scorer, a customer labels a calibration set (100 to 300 rows is usually enough to see whether the judge is usable), and the platform reports agreement between judge and human:
def judge_agreement(human: list[int], judge: list[int]) -> dict:
    n = len(human)
    observed = sum(h == j for h, j in zip(human, judge)) / n
    labels = set(human) | set(judge)
    expected = sum((human.count(l) / n) * (judge.count(l) / n) for l in labels)
    kappa = (observed - expected) / (1 - expected) if expected < 1 else 1.0
    return {"accuracy": observed, "cohens_kappa": kappa, "n": n}
Raw accuracy flatters a judge on unbalanced sets (if 90% of answers are fine, "always fine" scores 90%), so I show Cohen's kappa and the disagreeing rows. A scorer with weak kappa is marked "uncalibrated" and cannot be used in a blocking gate. Scorers are versioned, and any change to prompt, model or parameters invalidates the calibration.
Judge Cost and Running Big Jobs
A 5,000-row dataset × 3 variants × 2 order-swapped judges is tens of thousands of judge calls. The worker fleet handles this like any batch system:
- Per-tenant concurrency limits and provider rate limits, with a token-bucket per provider key, so one big experiment does not exhaust the customer's provider quota and take down their production app
- Caching of outputs keyed by a hash of (model, parameters, input), so changing one scorer does not regenerate every answer
- Per-task checkpoints, so an interrupted job resumes rather than restarts
- Cheap judges first, escalating only borderline rows to a large judge, with a cost estimate shown before the run
Reproducibility and noise. Even at temperature 0, outputs vary a little between calls. An experiment that differs by 1 point on 200 rows may be noise. So I compute bootstrap confidence intervals over rows and show them, and I recommend repeated runs for small datasets.
What I would do first vs later: first, versioned datasets, the experiment grid, exact and heuristic scorers, a basic judge with order swapping and caching. Later, calibration workflows with annotation queues, multi-judge ensembles and judge cost optimisation.
Deep-Dive: Online Evaluation, Drift, and Regression Gates
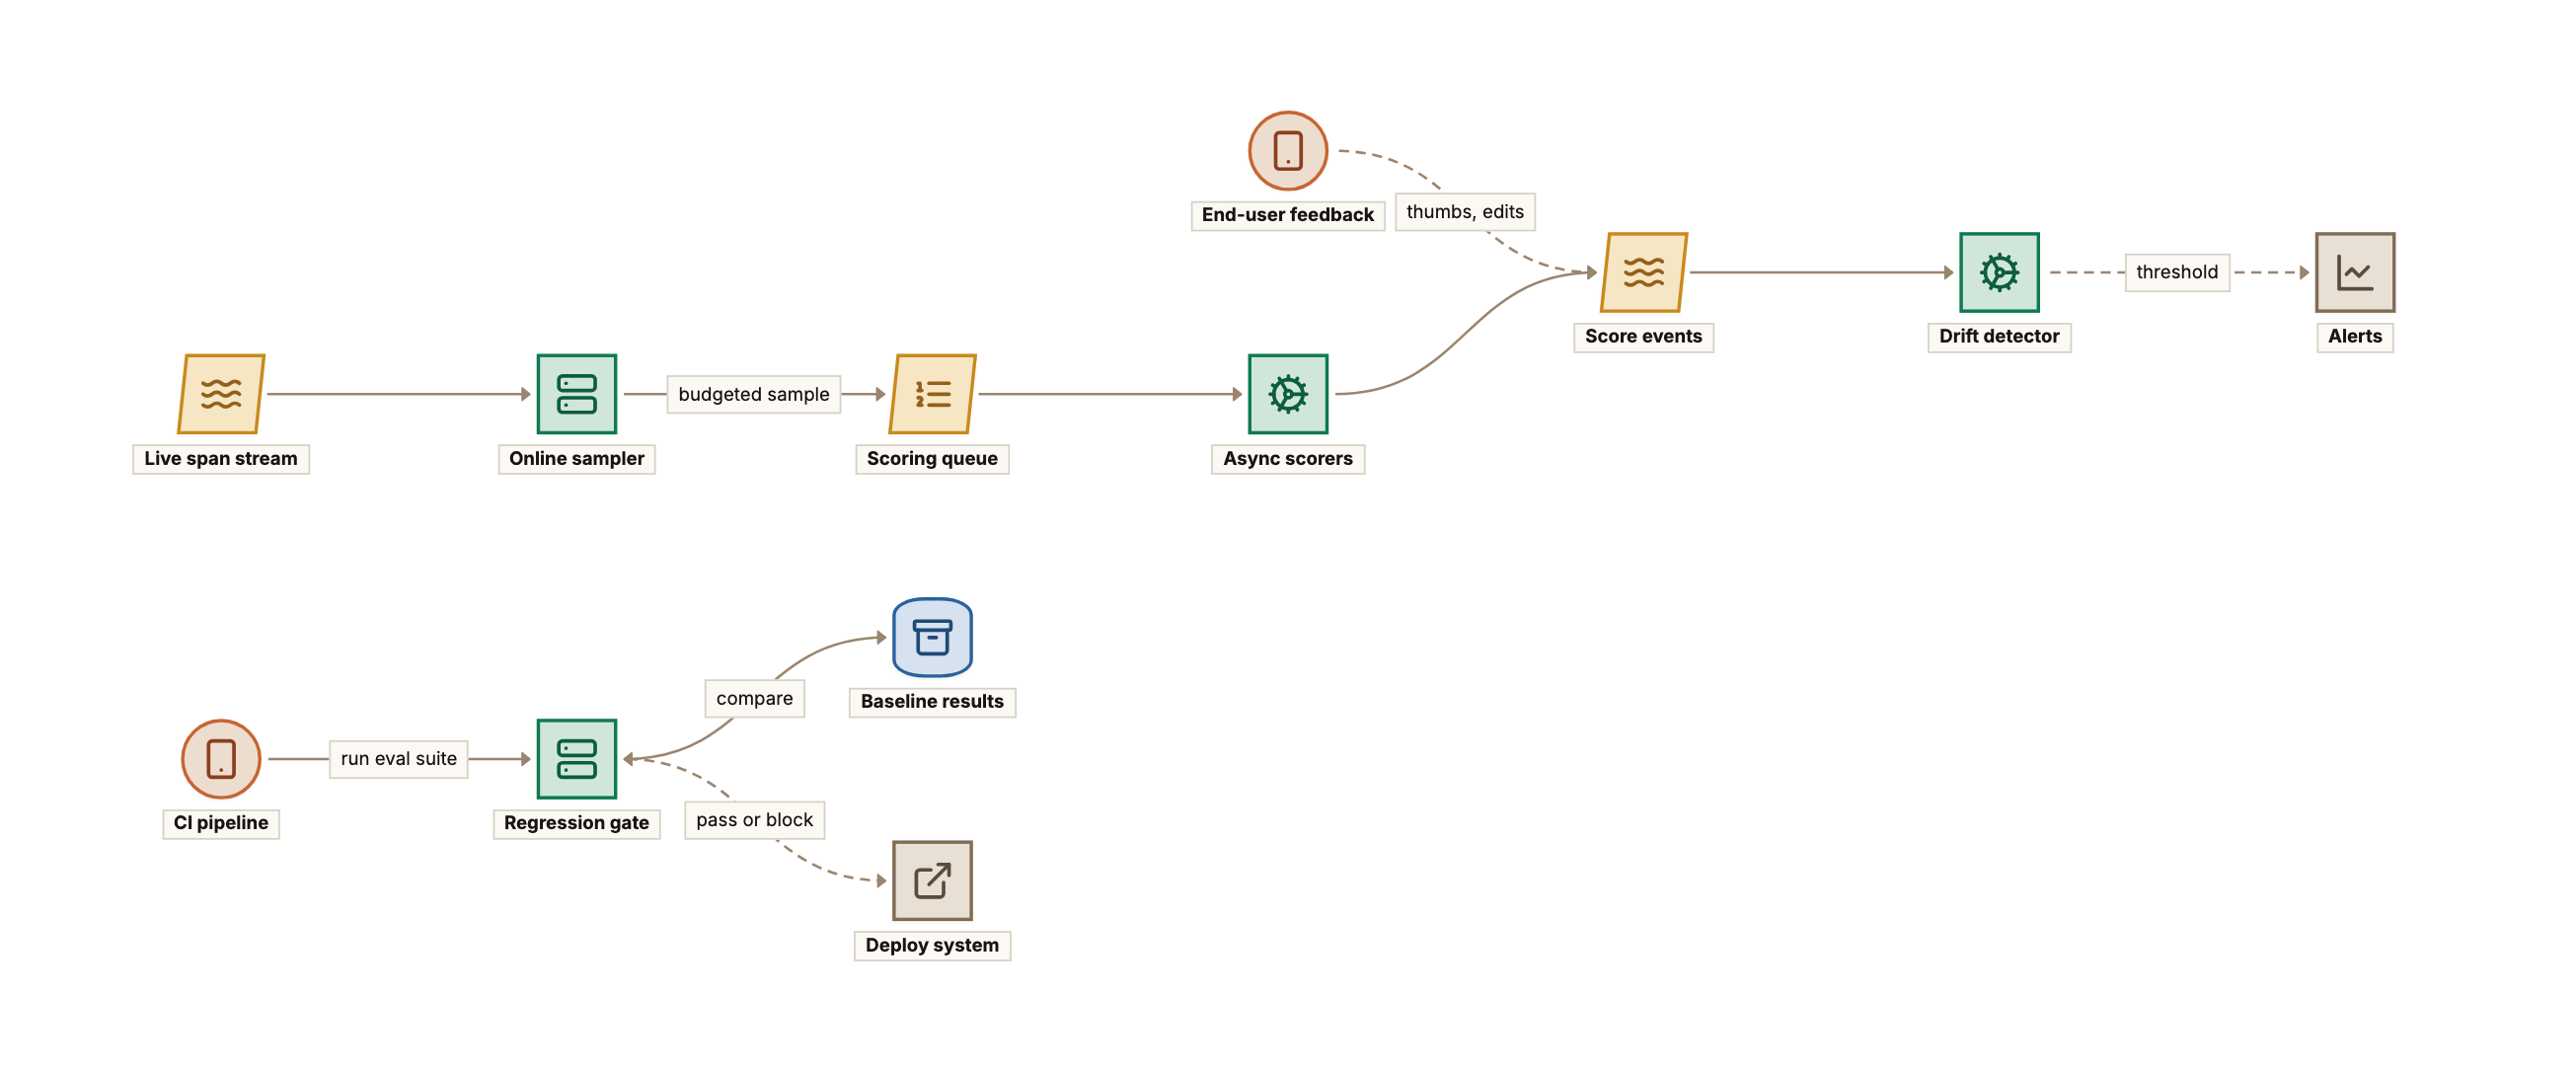
Scoring Live Traffic
Offline evals ask "is B better than A on my dataset". Online evals ask "is production OK right now", on inputs nobody curated. The design:
- Rules per project: a filter, a set of scorers, a sample rate and a daily budget in judge tokens or dollars.
- Deterministic sampling: once a trace settles, the sampler hashes its id against the rate, so retries and replays make the same decision.
- Budget enforcement: a per-rule token bucket. When the day's budget is gone, sampling pauses and the console says so. A visible gap beats a surprise judge bill.
- Async only. Scores arrive seconds to minutes later as
scorerows on the trace.
Cheap scorers (format checks, refusal detection, PII regex, length) run on 100% of traffic in the processor. Only model-graded scorers need sampling.
User Feedback
The SDK exposes log_feedback(trace_id, key, value, comment) for thumbs, ratings, "user edited the answer" or "escalated to a human". Feedback can arrive hours after the trace, so it is its own row, joined at query time. It is noisy and biased (unhappy users click more), so I treat it as a trend signal and mainly use negative feedback to route traces into review queues and datasets.
Drift
Two kinds of drift matter:
- Input drift: the questions change (a launch, a new language, a new user base). I track daily distributions of cheap features (input length, language, embedding topic cluster, tool mix) against a baseline window with a population stability index or a chi-squared test on topic buckets.
- Score drift: similar questions get worse answers, often with no deploy at all, for example when a provider updates a model behind an alias or a retrieval index goes stale. I track rolling means of each score with confidence bands.
A team paged for noise mutes the alert, so I require a minimum sample count, size windows to the sample rate, and link every alert to the lowest-scoring traces in the window.
CI Regression Gates
The gate turns all of this into a release decision. A customer adds a step to their CI pipeline that runs an experiment on the current commit against a pinned dataset version and compares with the baseline (the last accepted run on the main branch):
# eval-gate.yaml, checked into the customer's repo
project: support-bot
dataset: refund-regressions@v12
baseline: main@latest-passing
variants:
  candidate: { prompt: ./prompts/answer.txt, model: provider/model-large-2026-09 }
scorers:
  - name: tool_choice_correct      # exact
    min: 0.95
  - name: faithfulness_judge_v3    # model-graded, must be calibrated
    max_drop: 0.02                 # vs baseline, using the CI lower bound
  - name: answer_length_tokens
    max_increase_pct: 20
on_fail: block
The gate evaluates each condition on the confidence interval, not the point estimate: block if the lower bound of (candidate minus baseline) is below the allowed drop. Noise does not block good changes, and real regressions still fail. The CI check lists the regressed rows with trace links, so a failure is a debugging starting point. An explicit override with a reason is recorded against the user and commit, because teams sometimes accept a small quality drop for a large cost win, and a gate that cannot express that gets disabled.
A/B Comparison of Versions in Production
Offline wins do not always survive real traffic. When a customer runs two versions behind their own feature flag and tags spans with variant, the platform compares online scores, feedback, latency and cost per variant with the same interval statistics and the same view as experiments. Every comparison is two sets of scored rows.
What I would do first vs later: first, sampled online scoring with budgets, feedback ingestion, and the CI gate with interval-based thresholds. Later, input drift detection with embedding clusters, and automatic routing of low-scoring traces into annotation queues.
Deep-Dive: Cost and Latency Analytics at Scale
Token and Cost Attribution
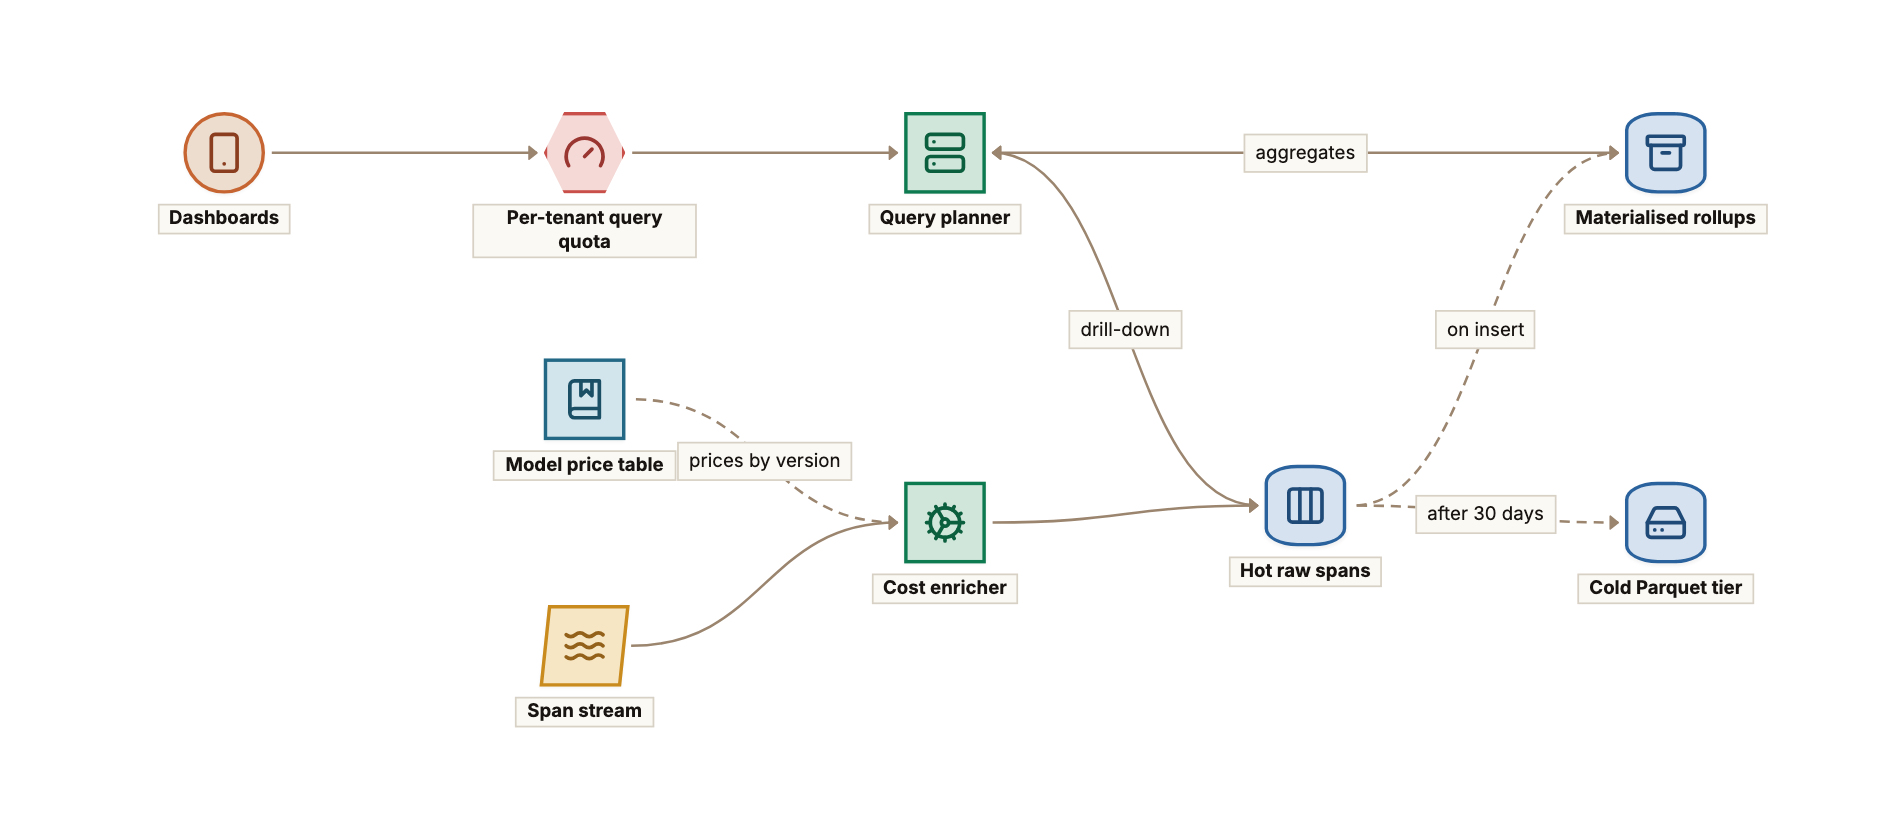
Every llm span carries input, cached and output tokens. The enricher multiplies by a versioned price table keyed by model and effective date and writes cost_usd, recording which price version it used, so a repricing job can recompute history when a customer has a negotiated rate.
Attribution is grouping by tags set at the root span (feature, customer_tier, user_id_hash) and propagated to children. I also compute cost per trace, because the customer's real unit is "cost per resolved ticket", not cost per model call.
Latency by Span Type
End-to-end latency mixes model TTFT and generation, tools, retrieval and agent overhead. I expose p50/p95/p99 per span kind, name and model, plus the critical path of a trace: which spans actually set the end-to-end time, since parallel tool calls overlap.
Percentiles cannot be summed across rollups, so rollups store mergeable quantile sketches (t-digest or similar) that combine across hours, projects and tags with accuracy good enough for dashboards.
Rollups and Materialised Views
Dashboards should never scan raw spans. I maintain incremental materialised views that aggregate on insert:
-- Target table is an AggregatingMergeTree; sums use SimpleAggregateFunction(sum, ...)
CREATE MATERIALIZED VIEW span_rollup_1h_mv TO span_rollup_1h AS
SELECT
    tenant_id,
    project_id,
    toStartOfHour(start_time)              AS hour,
    kind,
    model,
    feature,
    count()                                AS spans,
    sum(input_tokens)                      AS input_tokens,
    sum(output_tokens)                     AS output_tokens,
    sum(cost_usd)                          AS cost_usd,
    countIf(status = 'error')              AS errors,
    quantilesTDigestState(0.5, 0.95, 0.99)(duration_ms) AS latency_q
FROM spans
GROUP BY tenant_id, project_id, hour, kind, model, feature;
Rollups cover a fixed set of common dimensions, since rolling up every custom tag would explode cardinality. The planner uses a rollup when the query only touches its dimensions and falls back to raw spans, with a tighter time limit, otherwise.
Retention Tiers
| Tier | Data | Store | Default retention |
|---|---|---|---|
| Hot | span metadata + previews | columnar store on SSD | 30 days |
| Hot payloads | full bodies | object storage, with a small cache | 30 days |
| Cold | raw spans as Parquet | object storage, queried by a batch engine | per plan, e.g. 1 year |
| Aggregates | hourly and daily rollups | columnar store | 13 months or more |
| Pinned | spans referenced by datasets or experiments | copied into dataset storage | until deleted |
Pinning is important: a dataset row must not disappear because its source trace aged out. So adding a trace to a dataset copies its payload into the dataset's own storage.
Deletion requests hit both stores. Because payloads are packed into shared segment files, I encrypt them with per-tenant keys where customers require it: destroying the key makes the data unreadable at once, and compaction reclaims space later.
Query Performance on Billions of Spans
The sort key is (tenant_id, project_id, start_time, trace_id), partitioned by day. A typical console query ("this project, last 24 hours, llm spans costing over 1 cent, newest 50") reads one tenant's slice of one or two partitions and skips most granules with min/max indexes. Opening a trace reads one trace id's rows, then fetches payloads in parallel by byte range.
The queries that hurt are wide scans over high-cardinality tags across long ranges. I handle them with:
- Time range limits by default, with longer queries run as async jobs
- Skip indexes on commonly filtered attributes
- Promoting hot attributes from the JSON tag map to dedicated columns when a tenant filters on them often
Per-Tenant Isolation and Noisy Neighbours
Isolation works at three levels:
- Security: the query API injects
tenant_id = ?from the session into every query, and row policies in the store are a second layer. Nobody hand-writes tenant filters. - Ingest: edge quotas and tenant-keyed partitions, so one tenant's backlog delays only its own partitions.
- Query: per-tenant concurrency and memory limits, timeouts, and dedicated shards or clusters for the largest tenants.
The failure I worry about most is one tenant's 90-day ad-hoc scan during another tenant's incident. A capped "heavy query" lane handles it.
What I would do first vs later: first, cost enrichment with a versioned price table, hourly rollups with sketches, and tenant-scoped query rewriting with limits. Later, the cold Parquet tier with a batch query engine, automatic column promotion and dedicated clusters for the largest tenants.
Conclusion: Bringing It All Together
An LLM evaluation and observability platform is a tracing system whose spans are mostly text, attached to an evaluation engine that turns that text into scores and scores into decisions. Most of the design follows from a few facts: payloads are much larger than metadata, the interesting traces are rare and only visible after scoring, and the grader is itself a model with biases and a cost.
If I had to summarise the design in four decisions:
- Never block the customer, and split metadata from payloads. A background-batching SDK that fails open, a durable stream at ingest, metadata in a columnar store and bodies packed into object storage. That one split decides the cost structure.
- Treat evaluation as an experiment, not an opinion. Versioned datasets from production traces, cheap exact scorers wherever possible, and LLM judges that are order-swapped, length-aware and calibrated against human labels before they are allowed to gate anything.
- Score production continuously but on a budget, and gate on confidence intervals. Deterministic sampling, async scoring, feedback joins, drift alerts with minimum sample sizes, and CI gates that block only when a drop is real.
- Pre-aggregate everything a dashboard needs, and isolate tenants at every layer. Cost from versioned prices, mergeable latency sketches in rollups, tiered retention with pinning, and per-tenant quotas on both ingest and query.
Related reading: Designing an LLM Gateway, Designing an AI Agent Platform, Designing a Log Aggregation System, Designing an LLM Inference Platform, and Storage Engines and Indexes Compared.