How to Build Reliable Monitoring for Distributed Systems and Microservices
How to Build Reliable Monitoring for Distributed Systems and Microservices
Look, I've been there. You're running a microservices architecture that looked great on paper, but now you're getting paged at 3 AM because something, somewhere, is on fire. The worst part? You have no idea what's actually broken or where to even start looking.
If this sounds familiar, you're not alone. Most distributed systems today are essentially black boxes wrapped in more black boxes, monitored by tools that were designed for simpler times. But here's the thing, modern distributed monitoring isn't just about collecting metrics anymore. It's about building systems that can actually tell you what's happening when everything goes sideways.
The Real Problem with Traditional Monitoring
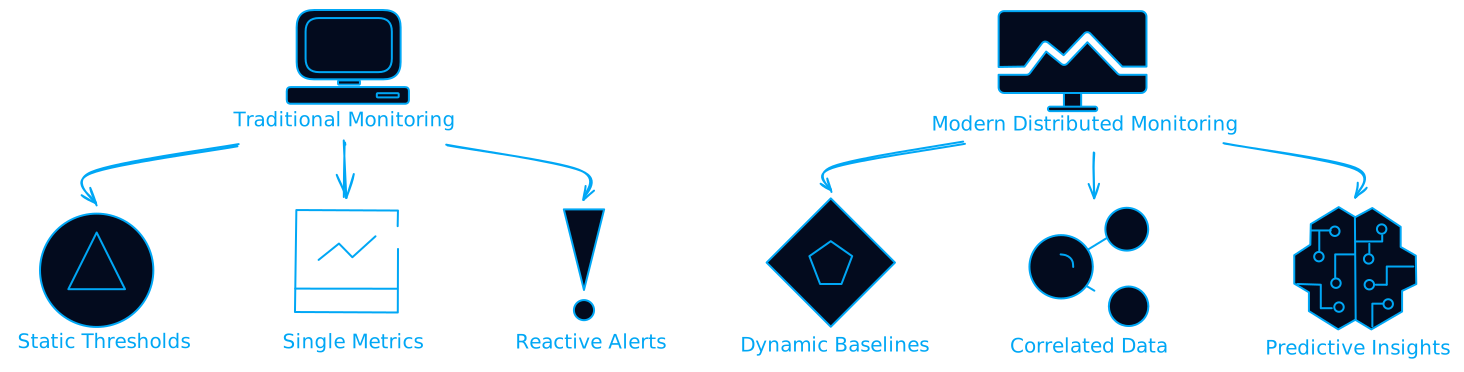
Traditional monitoring was built for a world where you had a few servers, maybe a database, and everything lived in one data center. You could SSH into a box, check some logs, and call it a day. Those days are long gone.
Today's systems are different beasts entirely:
- Ephemeral infrastructure that spins up and down faster than you can name it
- Service meshes with hundreds of interconnected components
- Multi-cloud deployments spread across regions and providers
- Container orchestration that moves workloads around like a shell game
The old approach of setting up static thresholds and hoping for the best just doesn't cut it anymore. You need something smarter.
The Five Pillars of Actually Useful Distributed Monitoring
1. Data Collection That Doesn't Suck
The foundation of any monitoring system is data collection, but most people get this wrong from the start. They either collect everything (and drown in noise) or collect too little (and miss the important stuff).
Smart data collection means:
- Agent-based collection that adapts to your infrastructure
- Sampling strategies that capture the right data without overwhelming your network
- Compression and batching to reduce overhead
- Multiple data types: metrics, logs, traces, and events working together
The key insight here is that you're not just collecting data, you're building a real-time representation of your system's behavior. Every metric, every log line, every trace span is a pixel in a larger picture.
2. Storage That Scales (Without Breaking the Bank)
Here's where most people hit their first major wall. You start collecting all this great data, and suddenly your storage costs are through the roof. Or worse, your queries are timing out because you're trying to search through petabytes of unindexed data.
The solution isn't just "throw more hardware at it." You need:
Time-series databases for metrics (InfluxDB, Prometheus, TimescaleDB)
- Optimized for time-based queries
- Built-in compression and retention policies
- Fast aggregation capabilities
Distributed storage for logs and traces (Elasticsearch, Cassandra, S3)
- Horizontal scaling
- Fault tolerance through replication
- Cost-effective long-term retention
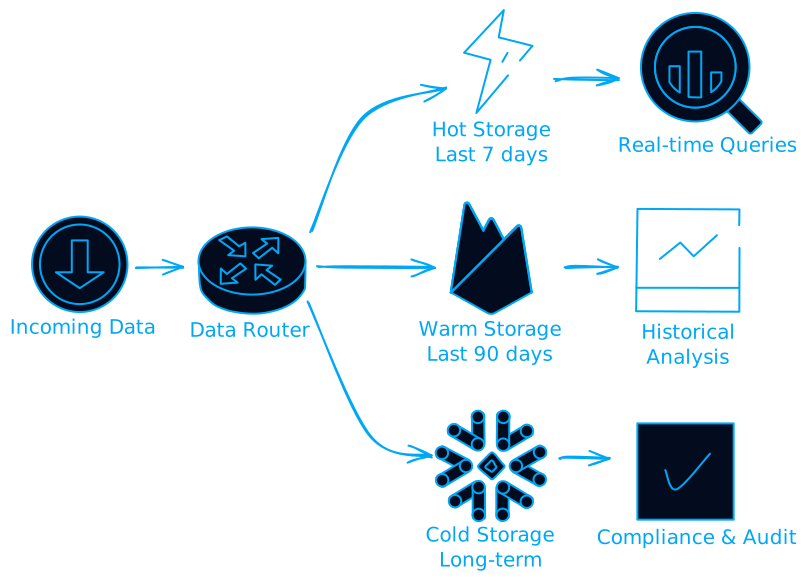
Hot/warm/cold storage tiers to optimize costs
- Recent data on fast SSDs
- Older data on cheaper storage
- Automated lifecycle management
3. Query Processing That Actually Works
This is where the magic happens, and where most systems fall apart. You've got data scattered across multiple nodes, different storage systems, and various time ranges. How do you make sense of it all?
Distributed query engines are your friend here. They can:
- Execute queries in parallel across multiple nodes
- Aggregate results from different data sources
- Provide a unified view of your entire system
- Handle complex joins and correlations
But here's the catch: you need to design your queries with distribution in mind. That means thinking about data locality, query optimization, and result caching from day one.
4. Alerting That Doesn't Cry Wolf
We've all been there. You set up some alerts, and suddenly you're getting 50 notifications a day about things that don't actually matter. Alert fatigue is real, and it's dangerous.
Smart alerting means:
Dynamic thresholds based on historical patterns
- Machine learning models that understand normal behavior
- Seasonal adjustments for predictable patterns
- Anomaly detection that adapts to your specific workloads
Alert correlation to reduce noise
- Group related alerts together
- Suppress downstream alerts when root causes are identified
- Escalation policies that make sense
Multiple notification channels for different scenarios
- Slack for non-critical issues
- PagerDuty for production outages
- Email for summary reports
# Example: Smart alerting with dynamic thresholds
class SmartAlerting:
    def __init__(self):
        self.baseline_model = TimeSeriesBaseline()
        self.anomaly_detector = AnomalyDetector()

    def evaluate_metric(self, metric_value, timestamp):
        expected_range = self.baseline_model.predict(timestamp)

        if self.anomaly_detector.is_anomaly(metric_value, expected_range):
            severity = self.calculate_severity(metric_value, expected_range)
            return Alert(severity=severity, context=self.get_context())

        return None
5. Visualization That Tells a Story
Dashboards are not just pretty pictures. They're the interface between your monitoring system and your brain. A good dashboard tells you what's happening, what's about to happen, and what you should do about it.
Key principles for effective visualization:
Hierarchical information architecture
- High-level health at the top
- Drill-down capabilities for details
- Context-aware navigation
Real-time updates without overwhelming the user
- Smart refresh rates based on data volatility
- Progressive disclosure of information
- Efficient rendering for large datasets
Mobile-friendly design because outages don't wait for you to get to your desk
The Observability Revolution: Beyond Traditional Monitoring
Here's where things get really interesting. Traditional monitoring asks "Is my system working?" Observability asks "Why is my system behaving this way?"
The difference is huge. Monitoring tells you that your response times are high. Observability tells you that it's because the authentication service is making too many database calls, which is causing connection pool exhaustion, which is cascading to other services.
The Three Pillars of Observability
Metrics: The "what" of your system
- Quantitative measurements over time
- CPU usage, request rates, error counts
- Great for alerting and trending
Logs: The "when" and "where" of events
- Discrete events with context
- Error messages, audit trails, debug information
- Essential for troubleshooting
Traces: The "how" of request flows
- End-to-end request journeys
- Service dependencies and timing
- Critical for understanding distributed systems
Distributed Tracing: Your New Best Friend
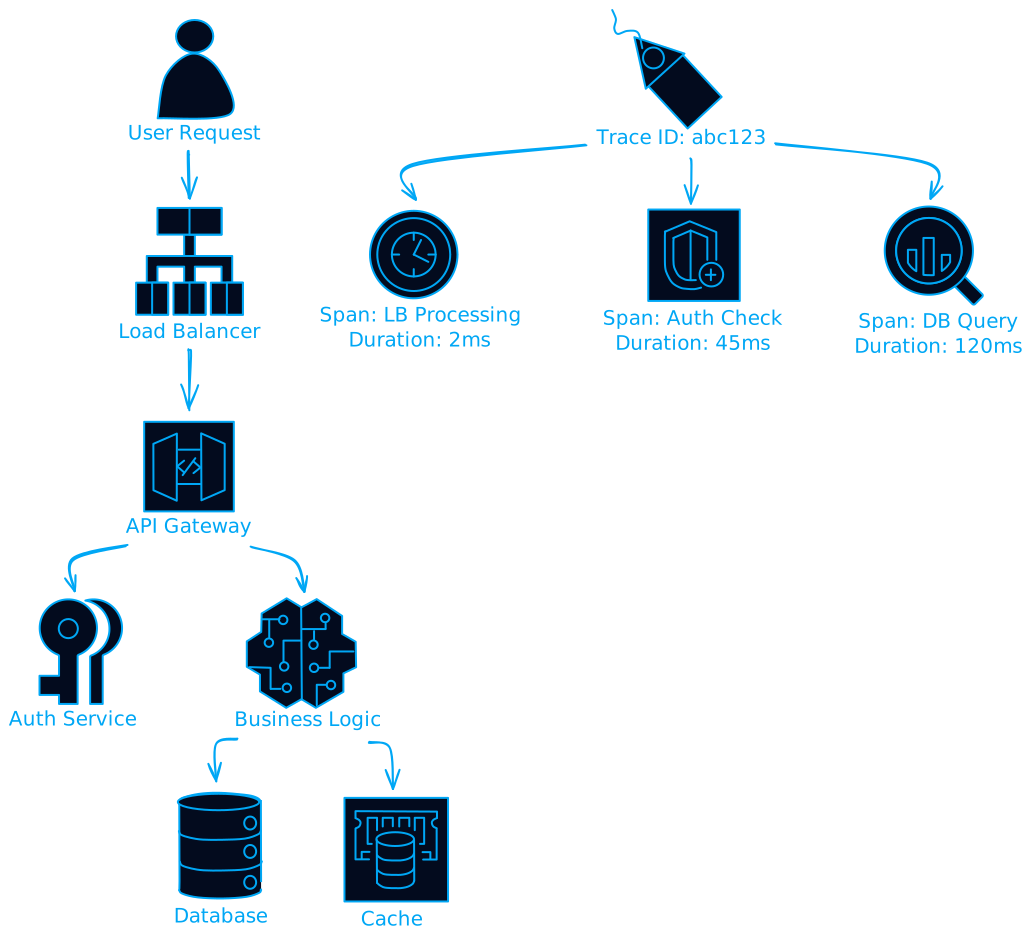
Distributed tracing is like having X-ray vision for your microservices. Every request gets a unique trace ID that follows it through your entire system. Each service adds its own "span" to the trace, recording what it did and how long it took.
When something goes wrong, you can follow the trace to see exactly where the problem occurred. No more guessing, no more correlation headaches.
Popular tracing tools:
- Jaeger: Open source, great for getting started
- Zipkin: Battle-tested, good ecosystem
- OpenTelemetry: The future, vendor-neutral standard
Design Patterns That Actually Work
The Circuit Breaker Pattern for Monitoring
Just like your electrical system has circuit breakers to prevent overloads, your monitoring system needs them too. When a service is clearly down, stop trying to monitor it every second. This prevents monitoring storms that can make outages worse.
class MonitoringCircuitBreaker:
    def __init__(self, failure_threshold=5, timeout=60):
        self.failure_count = 0
        self.failure_threshold = failure_threshold
        self.timeout = timeout
        self.last_failure_time = None
        self.state = "CLOSED"  # CLOSED, OPEN, HALF_OPEN

    def call_monitoring_endpoint(self, endpoint):
        if self.state == "OPEN":
            if time.time() - self.last_failure_time > self.timeout:
                self.state = "HALF_OPEN"
            else:
                return None  # Skip monitoring call

        try:
            result = endpoint.check_health()
            if self.state == "HALF_OPEN":
                self.state = "CLOSED"
                self.failure_count = 0
            return result
        except Exception:
            self.failure_count += 1
            self.last_failure_time = time.time()

            if self.failure_count >= self.failure_threshold:
                self.state = "OPEN"

            raise
The Bulkhead Pattern for Data Isolation
Don't let one noisy service drown out monitoring data from everything else. Use separate data streams, storage partitions, and processing queues for different service tiers.
The Saga Pattern for Complex Monitoring Workflows
When you need to coordinate monitoring across multiple systems (like during a deployment), use the saga pattern to ensure consistency even when parts of your monitoring infrastructure fail.
Cloud-Native Monitoring: Embracing the Chaos
Cloud-native environments are inherently chaotic. Services come and go, containers migrate between nodes, and auto-scaling means your infrastructure is constantly changing. Your monitoring needs to embrace this chaos, not fight it.
Auto-Discovery and Dynamic Configuration
Your monitoring system should automatically discover new services and start monitoring them without manual configuration. This means:
- Service mesh integration for automatic service discovery
- Kubernetes operators that deploy monitoring alongside applications
- Configuration as code that versions monitoring rules with application code
Container and Kubernetes Monitoring
Containers add layers of abstraction that traditional monitoring tools struggle with. You need to monitor:
- Container resource usage (CPU, memory, network, disk)
- Kubernetes cluster health (node status, pod scheduling, resource quotas)
- Application metrics exposed through the container
- Container lifecycle events (starts, stops, crashes, restarts)
# Example: Kubernetes monitoring configuration
apiVersion: v1
kind: ConfigMap
metadata:
  name: monitoring-config
data:
  prometheus.yml: |
    global:
      scrape_interval: 15s

    scrape_configs:
    - job_name: 'kubernetes-pods'
      kubernetes_sd_configs:
      - role: pod
      relabel_configs:
      - source_labels: [__meta_kubernetes_pod_annotation_prometheus_io_scrape]
        action: keep
        regex: true
The AI/ML Revolution in Monitoring
This is where things get really exciting. Machine learning isn't just a buzzword in monitoring anymore, it's becoming essential for managing the complexity of modern systems.
Anomaly Detection That Actually Works
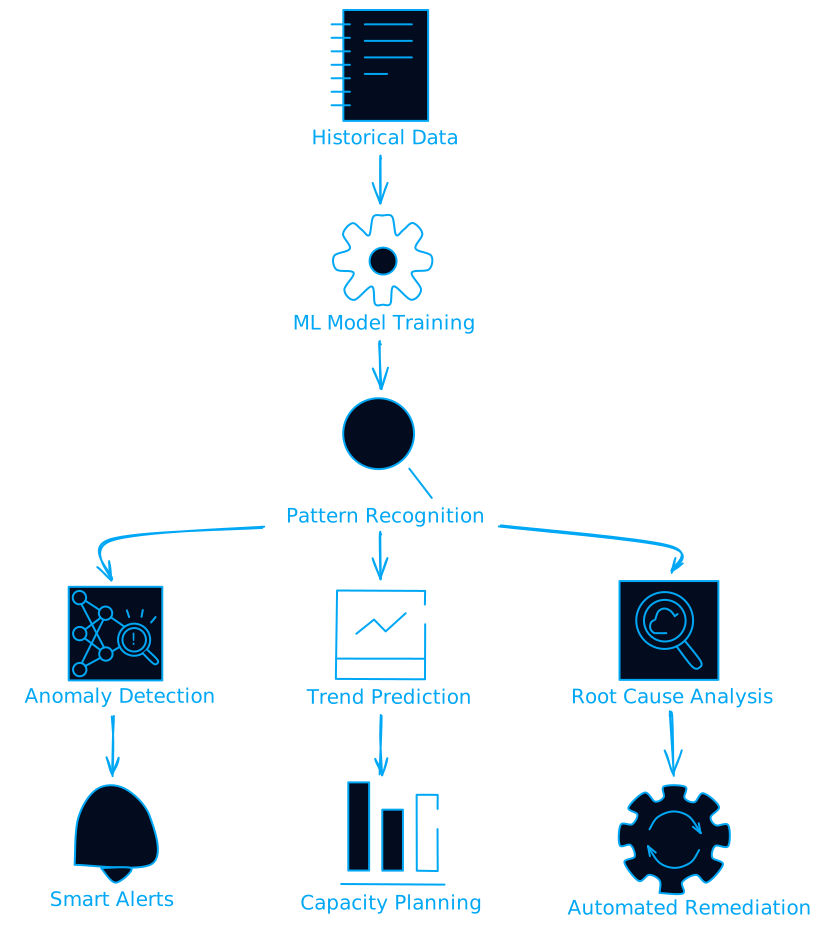
Traditional threshold-based alerting assumes you know what "normal" looks like. But in dynamic systems, normal is constantly changing. ML-based anomaly detection can:
- Learn seasonal patterns (traffic spikes during business hours, batch job patterns)
- Adapt to gradual changes (growing user base, code deployments)
- Detect complex anomalies that span multiple metrics
- Reduce false positives by understanding correlation patterns
Predictive Analytics for Proactive Operations
Instead of just reacting to problems, ML can help you prevent them:
- Capacity planning based on growth trends and usage patterns
- Failure prediction using leading indicators
- Performance optimization by identifying bottlenecks before they impact users
- Cost optimization by predicting resource needs
Security and Compliance: The Stuff Nobody Talks About
Let's be honest, security and compliance are boring. But they're also critical, and most monitoring systems are terrible at both.
Monitoring Data as a Security Asset (and Liability)
Your monitoring data contains a treasure trove of information about your systems. It can also contain sensitive information that you didn't mean to collect. You need:
Data classification and retention policies
- Automatic PII detection and redaction
- Compliance with GDPR, HIPAA, SOX requirements
- Secure data destruction after retention periods
Access controls and audit trails
- Role-based access to monitoring data
- Audit logs for all data access
- Integration with identity providers
Encryption everywhere
- Data in transit (TLS for all communications)
- Data at rest (encrypted storage)
- Key management and rotation
Monitoring Your Security Posture
Your monitoring system should also be monitoring your security. This means:
- Security event correlation across logs and metrics
- Threat detection using behavioral analysis
- Compliance monitoring for configuration drift
- Incident response integration with security tools
The Future: Where We're Heading
The monitoring landscape is evolving rapidly. Here's what's coming next:
OpenTelemetry: The Universal Standard
OpenTelemetry is becoming the standard for observability data collection. It provides:
- Vendor-neutral instrumentation that works with any backend
- Automatic instrumentation for popular frameworks
- Consistent data formats across different tools
- Reduced vendor lock-in and easier tool migration
Edge Computing and IoT Monitoring
As computing moves to the edge, monitoring needs to follow:
- Distributed monitoring architectures that work with intermittent connectivity
- Edge-native data processing to reduce bandwidth requirements
- Hierarchical data aggregation from edge to cloud
- Specialized monitoring for IoT devices with limited resources
Chaos Engineering Integration
Monitoring and chaos engineering are natural partners:
- Automated failure injection based on monitoring data
- Blast radius detection using observability tools
- Recovery validation through monitoring metrics
- Continuous resilience testing integrated with CI/CD
Building Your Monitoring Strategy: A Practical Roadmap
Alright, enough theory. How do you actually build a monitoring system that works? Here's a practical roadmap:
Phase 1: Get the Basics Right (Weeks 1-4)
- Instrument your applications with basic metrics
- Set up centralized logging with structured formats
- Deploy a time-series database for metrics storage
- Create basic dashboards for system health
- Implement simple alerting for critical failures
Phase 2: Add Intelligence (Weeks 5-12)
- Implement distributed tracing for key user journeys
- Add anomaly detection for important metrics
- Create runbooks linked to alerts
- Set up alert correlation to reduce noise
- Implement auto-discovery for dynamic environments
Phase 3: Scale and Optimize (Months 4-6)
- Optimize data retention and storage costs
- Implement predictive analytics for capacity planning
- Add security monitoring and compliance features
- Create self-service dashboards for development teams
- Integrate with incident management workflows
Phase 4: Advanced Capabilities (Months 7-12)
- Deploy AI-powered root cause analysis
- Implement automated remediation for common issues
- Add chaos engineering integration
- Create business metrics dashboards
- Optimize for edge computing scenarios
Common Pitfalls (And How to Avoid Them)
The "Monitor Everything" Trap
Just because you can monitor something doesn't mean you should. Focus on:
- Business-critical metrics that impact users
- Leading indicators that predict problems
- Actionable alerts that require human intervention
The "Tool Sprawl" Problem
Don't fall into the trap of using different tools for every monitoring need. Consolidate where possible:
- Unified data collection with OpenTelemetry
- Integrated platforms that handle multiple data types
- Standardized dashboards across teams
The "Set and Forget" Mistake
Monitoring systems need maintenance just like any other system:
- Regular review of alert effectiveness
- Continuous optimization of data retention
- Periodic training for operations teams
Wrapping Up: The Monitoring Mindset
Building effective distributed monitoring isn't just about tools and technologies. It's about developing a mindset that embraces complexity, expects failure, and values observability as a first-class concern.
The best monitoring systems are the ones you don't notice when everything is working, but that give you superpowers when things go wrong. They turn the chaos of distributed systems into comprehensible patterns, and they help you build more reliable systems over time.
Remember: monitoring is not a destination, it's a journey. Start with the basics, iterate based on what you learn, and always keep the end goal in mind: building systems that your users can depend on, even when the unexpected happens.
Your future self (and your on-call rotation) will thank you.
Want to dive deeper into distributed monitoring? Check out the OpenTelemetry documentation, experiment with Jaeger for distributed tracing, and consider starting with Prometheus and Grafana for a solid foundation. The monitoring landscape is evolving rapidly, but the principles in this post will serve you well regardless of which specific tools you choose.