A Deep Dive into Real-Time Log Search at Scale : AWS Cloudwatch Log Insights
So you've probably used CloudWatch Logs Insights before. You paste in a query, hit run, and boom, results appear in seconds even though you're searching through terabytes of logs. Ever wonder how that actually works under the hood?
I spent some time researching AWS's architecture patterns, and honestly, the engineering behind this thing is pretty wild. Let me walk you through it.
The Problem: Why Traditional Log Search Sucks
Before we get into the solution, let's talk about the problem. Imagine you're on-call at 3 AM. Your service is throwing errors. You need to find out which customers are affected, what the error messages say, and when it started happening.
Traditional approaches? They're painful:
- SSH into hosts: Manually grep through log files on individual servers. Risky, slow, and you might accidentally delete something important.
- Row-based storage: Logs stored as complete lines in S3. To find anything, you read EVERYTHING. A 1TB log file? You're scanning all 1TB even if you only care about timestamps and error codes.
- Batch processing: Wait 30+ minutes for logs to show up in your analytics system. By then, half your customers have already churned.
The Big Idea: Columnar Storage + Ephemeral Compute
Here's where AWS got clever. They built CloudWatch Logs Insights around two core concepts:
- Store logs in columnar format instead of rows
- Spin up query clusters on-demand instead of maintaining permanent infrastructure
Let me break down why this matters.
Columnar Storage for Logs
Think about how you'd organize a library. Traditional log storage is like storing complete books on shelves. Want to find all books published in 2020? You have to pull down every single book and check the publication date.
Columnar storage is different. It's like having separate shelves for titles, authors, publication dates, and content. Need books from 2020? Just check the publication date shelf.
Here's a concrete example. Say you have this log entry:
{
  "timestamp": "2026-01-19T08:30:45Z",
  "level": "ERROR",
  "message": "Database connection timeout",
  "user_id": "user_12345",
  "request_id": "req_abc123",
  "duration_ms": 5000
}
Row-based storage (traditional):
[timestamp][level][message][user_id][request_id][duration_ms]
[timestamp][level][message][user_id][request_id][duration_ms]
[timestamp][level][message][user_id][request_id][duration_ms]
To find all ERROR logs, you read every single field of every single row.
Columnar storage (CloudWatch Logs Insights):
Timestamp column: [2026-01-19T08:30:45Z, 2026-01-19T08:31:12Z, ...]
Level column:     [ERROR, INFO, ERROR, ...]
Message column:   [Database connection timeout, Request completed, ...]
User_id column:   [user_12345, user_67890, ...]
Now to find ERROR logs? Just scan the "level" column. Ignore everything else. This is why queries return in seconds instead of minutes.
AWS uses a format similar to Apache ORC (Optimized Row Columnar) for this. They store these columnar files in S3.

Ephemeral Compute: Pay Only When You Query
Here's the second clever bit. Most analytics systems keep a cluster running 24/7. You're paying for compute even when nobody's running queries.
CloudWatch Logs Insights does something different. When you click "Run query," AWS:
- Grabs EC2 instances from a warm pool (pre-provisioned but idle)
- Spins up a short-lived query cluster just for your query
- The cluster reads directly from S3, filters and aggregates data
- Returns results to you
- Terminates the cluster when done
It's like Uber for compute. You only pay when you're actually using it.
The Full Architecture: How It All Fits Together
Let me walk you through what happens when you send logs to CloudWatch and then query them.
Step 1: Log Ingestion
Your application sends logs using the CloudWatch Logs API. Here's what happens:
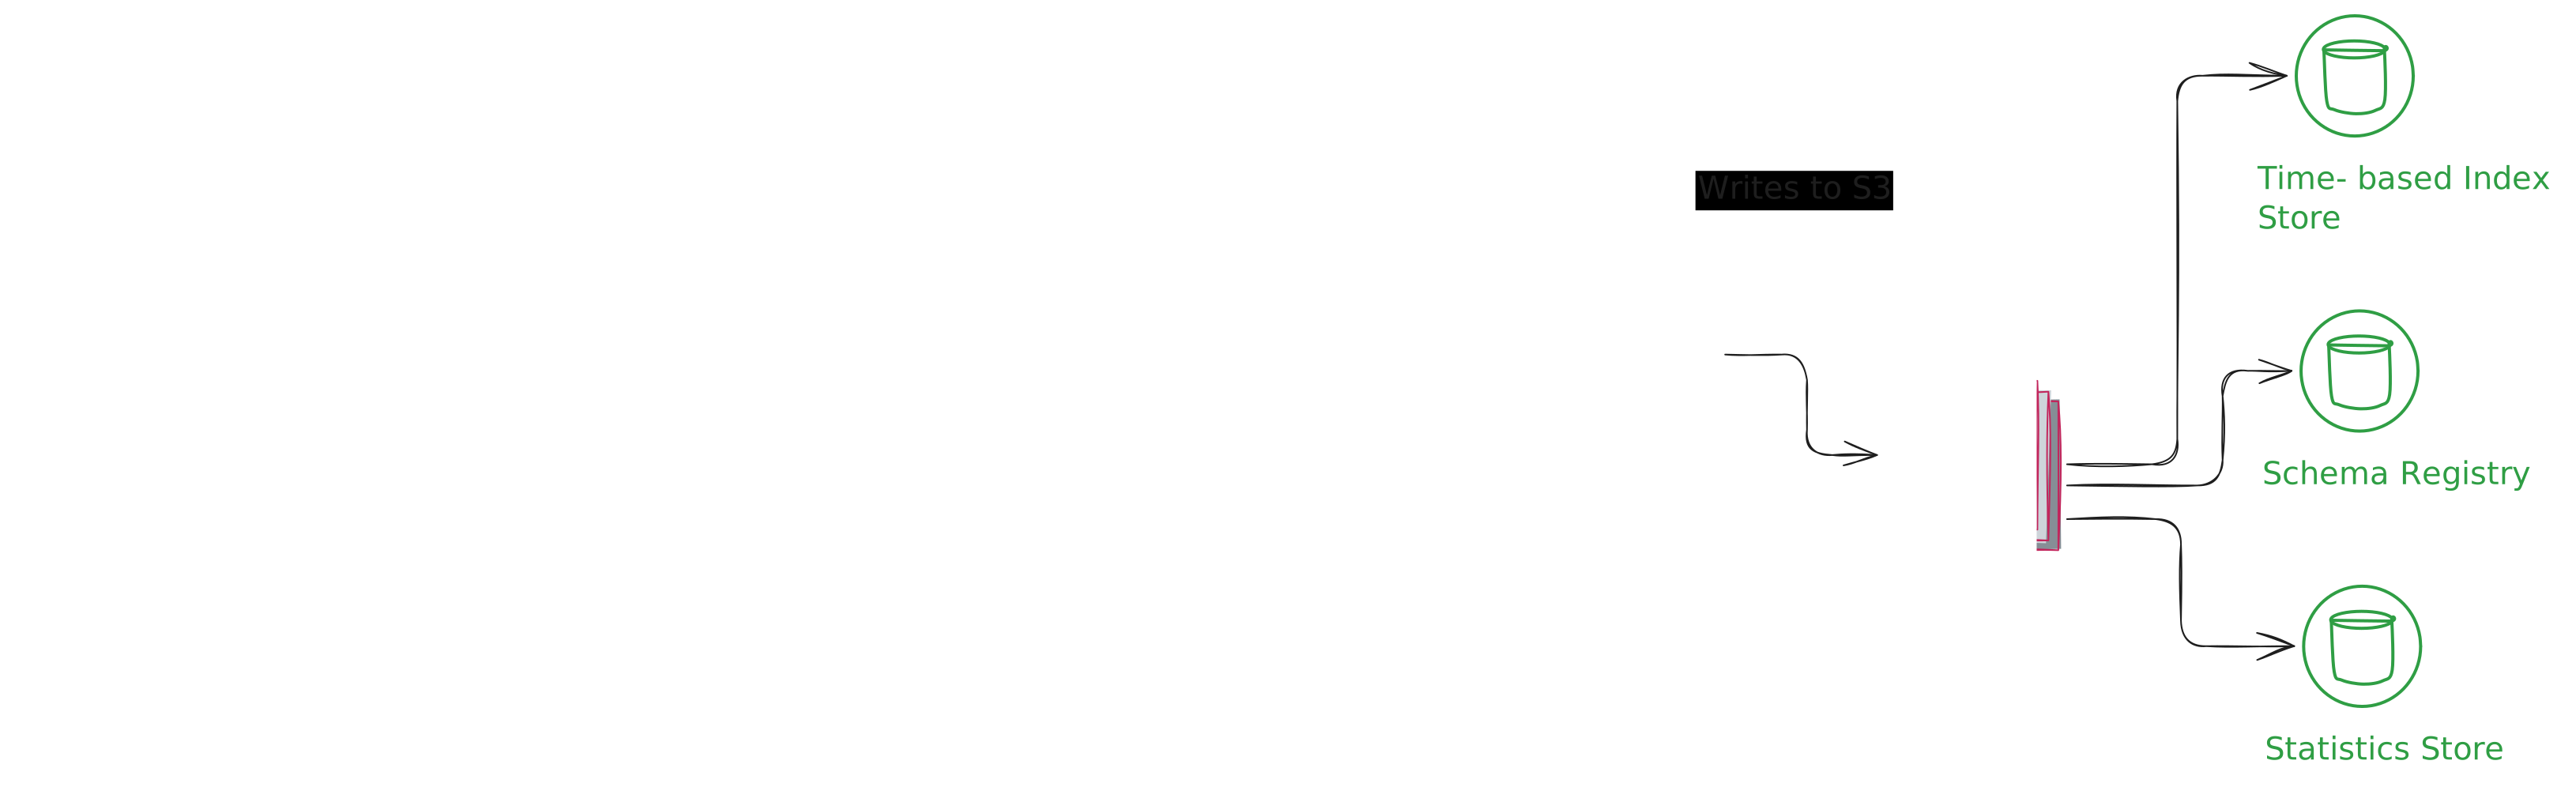
API Gateway: This is the entry point. It handles millions of transactions per second, ingesting hundreds of gigabytes of log data every second.
Streaming Buffer: Logs get buffered in a streaming service. This provides durability and allows for replay if something goes wrong.
Ingestion Workers: This is where the magic starts. The workers:
- Poll log events from the stream in batches
- Detect the log format (JSON, plain text, etc.)
- Parse the logs into structured fields
- Convert them into columnar format
- Write to S3
Metadata Layer: While writing to S3, the system also updates metadata services:
- Time-based Index: Tracks which S3 objects contain logs for specific time ranges
- Schema Registry: Stores schema information and log group metadata
- Statistics Store: Keeps statistics for query optimization
Step 2: Running a Query
Now let's say you want to find all ERROR logs from the last hour. You write a query like:
fields @timestamp, @message, user_id
| filter level = "ERROR"
| stats count() by user_id
| sort count desc
Here's what happens behind the scenes:
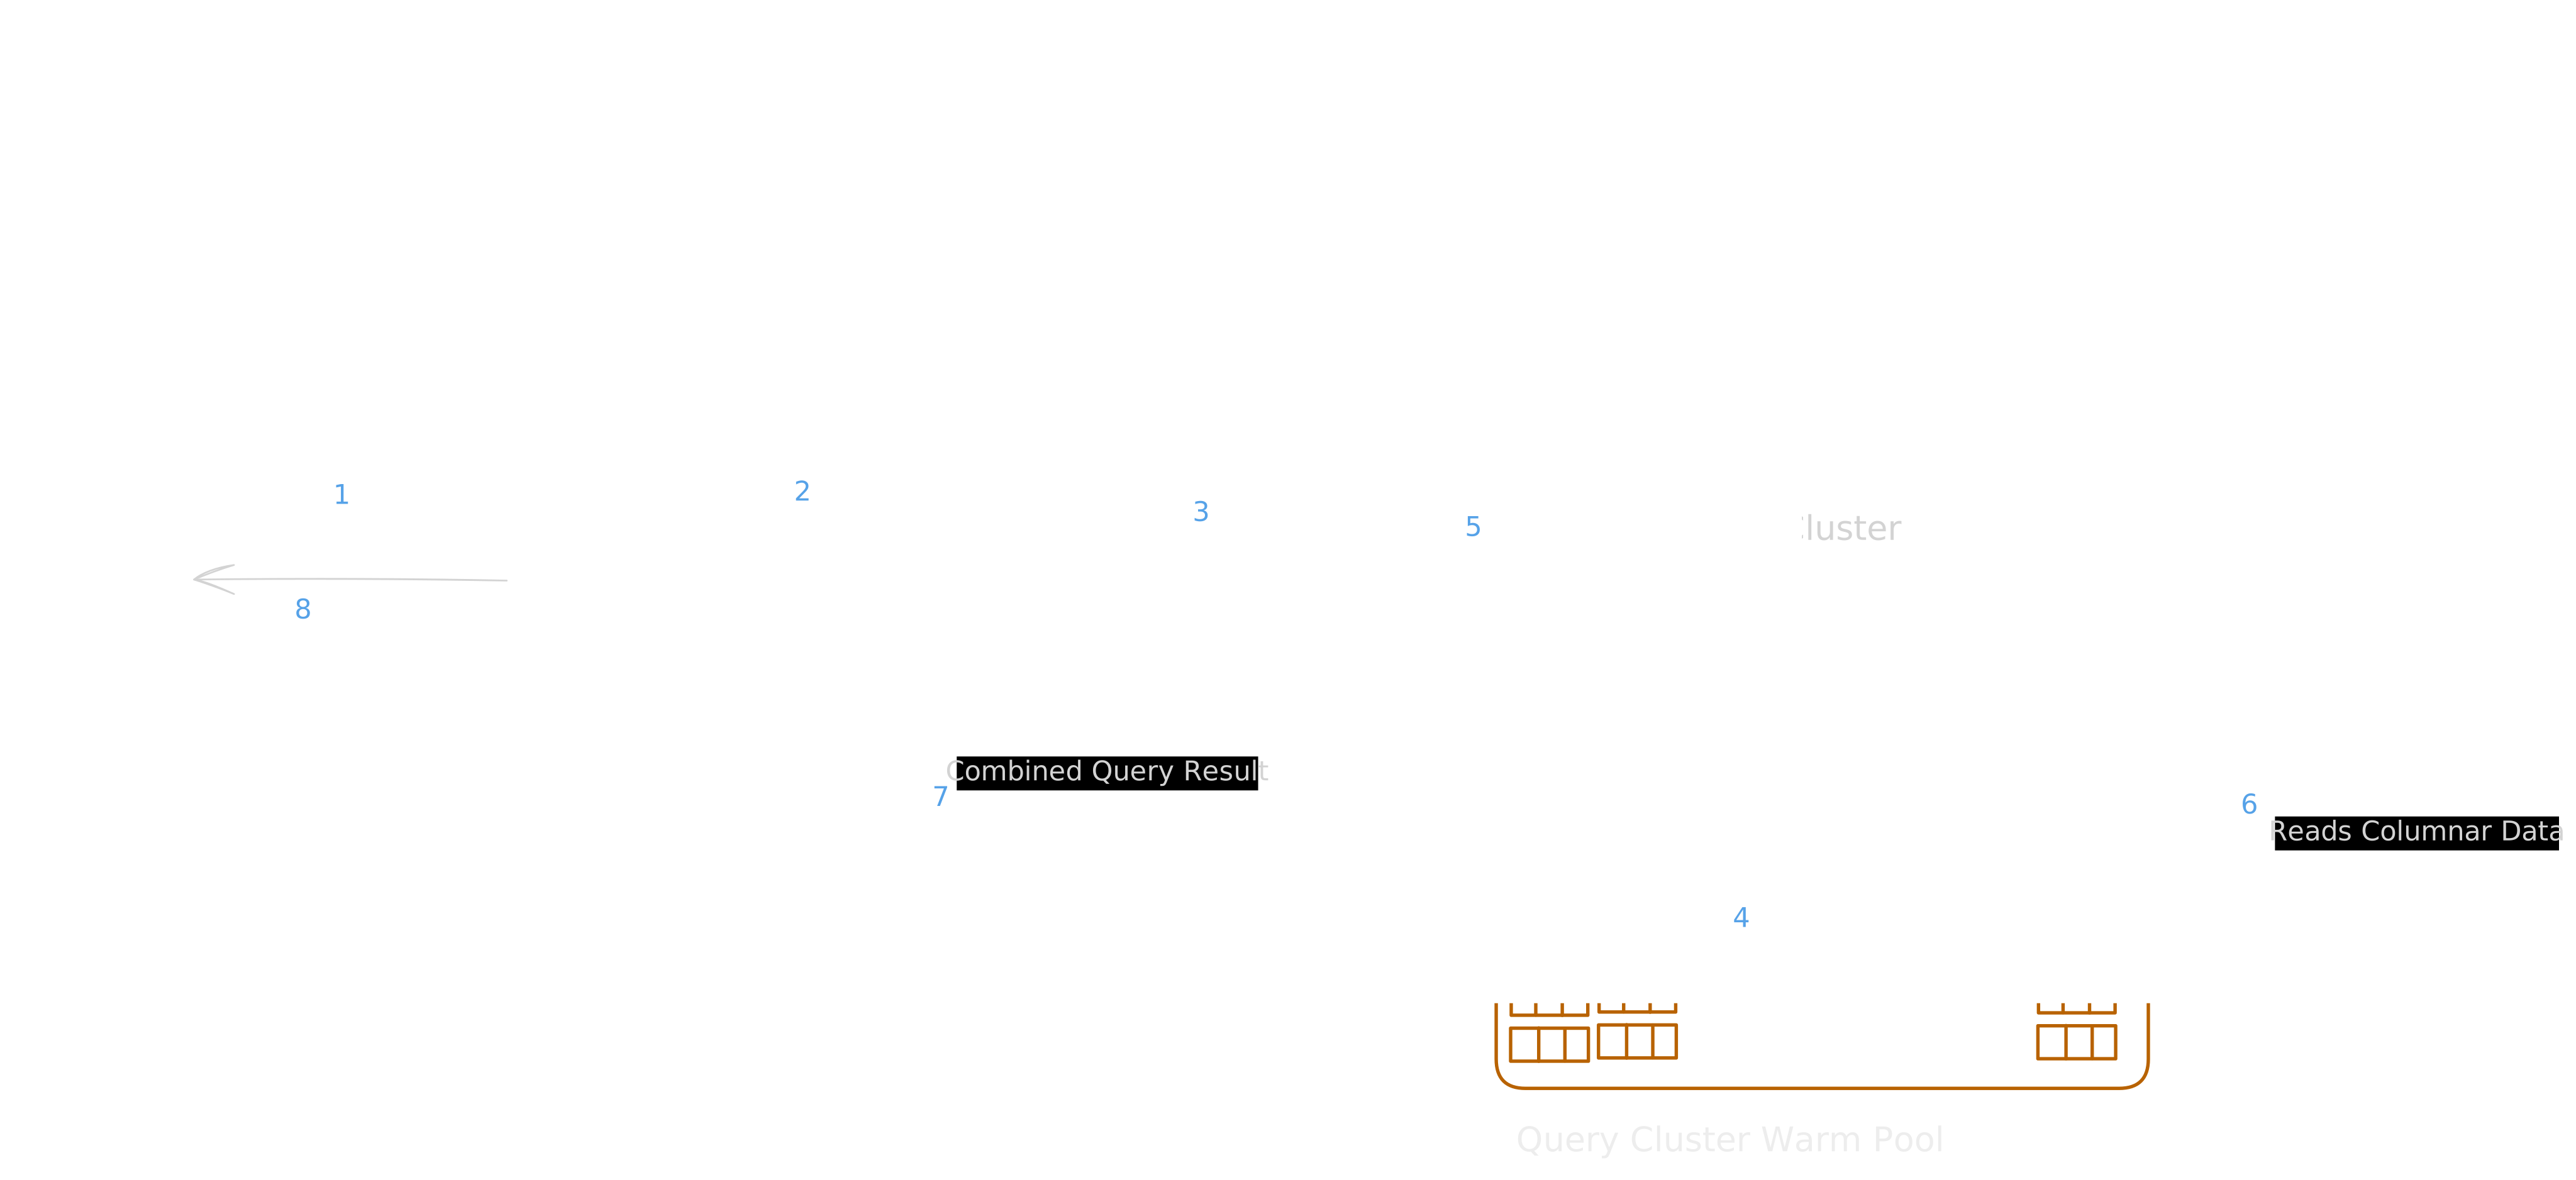
Query Coordinator: This component manages query execution. It maintains WebSocket connections with the console so you get results in real-time.
Metadata Lookup: Before reading any data, the system checks metadata to figure out which S3 objects contain logs from your time range. If you're querying the last hour, it might only need to read 10 objects instead of 10,000.
Query Cluster Creation: Here's the cool part. AWS maintains a warm pool of EC2 instances. When your query comes in, they grab a few instances, form a cluster, and assign your query to it.
Parallel Execution: Each node in the cluster gets a subset of S3 objects to process. Because the data is columnar, each node only reads the columns you care about (timestamp, level, message, user_id). Everything else stays on disk.
Aggregation: Results get aggregated across nodes and sent back to you.
Cleanup: Once your query finishes, the cluster gets terminated. Those EC2 instances go back to the warm pool for the next query.
Real-World Example: Debugging a Production Incident
Let's make this concrete. Say you're running an e-commerce site. At 2 PM, your payment service starts failing. Customers are complaining they can't check out.
You open CloudWatch Logs Insights and run:
fields @timestamp, @message, customer_id, error_code
| filter service = "payment" and level = "ERROR"
| filter @timestamp >= ago(1h)
| stats count() as error_count by error_code, customer_id
| sort error_count desc
| limit 20
What happens:
- The query hits the coordinator
- Metadata services identify S3 objects from the last hour (maybe 50 objects out of 100,000 total)
- A query cluster spins up with, say, 10 nodes
- Each node gets 5 S3 objects to process
- Each node reads ONLY the columns: timestamp, message, customer_id, error_code, service, level
- They filter for
service = "payment"andlevel = "ERROR" - They aggregate by error_code and customer_id
- Results combine and sort
- You get results in 3-5 seconds
The output might look like:
error_code              customer_id    error_count
PAYMENT_GATEWAY_TIMEOUT cust_12345     47
PAYMENT_GATEWAY_TIMEOUT cust_67890     45
INVALID_CARD            cust_11111     12
Boom. You immediately know:
- The issue is payment gateway timeouts
- Two customers are heavily affected
- It started around 1:15 PM (based on timestamps)
You can now escalate to the payment gateway team with concrete data instead of vague "something's broken" reports.
But Wait, What About...?
"Doesn't columnar storage take up more space?"
Good question. Actually, no. Columnar formats compress REALLY well because similar data types are stored together.
Think about it: a column of timestamps compresses better than rows mixing timestamps, strings, numbers, and booleans. AWS uses compression algorithms optimized for each data type.
In practice, columnar storage often uses 30-50% less space than row-based formats.
"What if my logs don't have a consistent schema?"
CloudWatch Logs Insights handles this gracefully. The ingestion pipeline detects fields dynamically. If one log has user_id and another doesn't, it just stores null for that field.
You can query semi-structured logs just fine:
fields @timestamp, @message
| filter ispresent(user_id)
| stats count() by user_id
This finds all logs that actually have a user_id field.
"How does it handle massive queries across months of data?"
Two things:
-
Time-based partitioning: Logs are organized by time in S3. If you query a specific time range, only those objects get read.
-
Query limits: CloudWatch Logs Insights has a 60-minute timeout and can query up to 50 log groups at once. For truly massive historical analysis, AWS recommends exporting to S3 and using Athena or EMR.
"What about cost? Isn't spinning up clusters expensive?"
Surprisingly, no. Because clusters are ephemeral and shared across customers, AWS can optimize utilization. You pay $0.005 per GB of data scanned.
Compare this to running a permanent Elasticsearch cluster for log search. You'd pay for compute 24/7 even when idle. With Logs Insights, you only pay when querying.
Key Takeaways for Your Own Systems
If you're building a log analytics system (or any large-scale data system), here's what you can learn from CloudWatch Logs Insights:
-
Columnar storage is a game-changer for analytical queries. If you're scanning large datasets repeatedly, convert to Parquet or ORC.
-
Separate storage from compute. Store data cheaply in S3 (or equivalent). Spin up compute only when needed. This is the core idea behind modern data lakes.
-
Metadata is crucial. Don't scan everything. Build indexes that tell you where relevant data lives.
-
Warm pools reduce cold start latency. Pre-provisioning idle resources lets you respond quickly without paying for 24/7 compute.
-
Design for time-series queries. Most log queries are time-bound. Partition your data by time and you'll skip 90% of irrelevant data.
Try It Yourself
Want to see this in action? Here's a quick experiment:
- Send some logs to CloudWatch Logs (use the AWS CLI or SDK)
- Open CloudWatch Logs Insights in the console
- Run this query:
fields @timestamp, @message
| filter @message like /error/i
| stats count() as error_count by bin(5m)
This finds all logs containing "error" (case-insensitive) and groups them into 5-minute buckets. Watch how fast it returns even if you have gigabytes of logs.
Then try the same query with | filter @timestamp >= ago(7d) to search a week of data. Still fast, right? That's columnar storage and ephemeral compute at work.
What's Next?
AWS continues to evolve CloudWatch Logs Insights. Recent developments include:
- Apache Iceberg integration: Transitioning to open table formats for even better performance and interoperability
- Cross-account querying: Query logs across multiple AWS accounts from a single interface
- Enhanced anomaly detection: ML-powered insights that automatically flag unusual patterns
The core architecture, though? Columnar storage + ephemeral compute. That's not changing because it works.
Bottom line: CloudWatch Logs Insights is a masterclass in building scalable analytics systems. By storing data in columnar format and spinning up compute on-demand, AWS delivers sub-second query performance on terabytes of logs without breaking the bank.
Next time you're debugging a production issue at 3 AM and your query returns in 2 seconds, you'll know exactly why. And maybe, just maybe, you'll appreciate the engineering a little more.
Now go forth and query those logs. Your future on-call self will thank you.