Back-of-the-Envelope Calculations: A Complete Guide to Resource Estimation
Back-of-the-Envelope Calculations
Ever been in a system design interview where someone asks "How many servers would Netflix need?" and you just... freeze? Yeah, we've all been there. The thing is, you don't need a PhD in mathematics to nail these calculations. You just need to know the right approach.
Back-of-the-envelope calculations are like having a superpower in the tech world. They help you quickly estimate resources, plan capacity, and make informed decisions without getting lost in complex spreadsheets. Whether you're designing the next big social media platform or just trying to figure out if your startup can handle Black Friday traffic, these calculations are your best friend.
Let me walk you through everything you need to know about resource estimation, from basic server calculations to handling massive AI workloads. By the end of this post, you'll be throwing around numbers like a seasoned architect.
What Are Back-of-the-Envelope Calculations?
Think of back-of-the-envelope calculations as educated guesses with structure. They're quick, rough estimates that help you understand the scale and requirements of a system without diving into detailed analysis.
The beauty of these calculations lies in their simplicity. You're not trying to be 100% accurate, you're trying to be in the right ballpark. If your calculation says you need 10 servers and the real answer is 12, that's a win. If you estimate 10 and need 1000, well, that's a problem.
Server Capacity and Peak Load Estimation
How Many Servers Do You Actually Need?
This is probably the most common question in system design interviews, and honestly, it's not that scary once you break it down.
Here's my step-by-step approach:
Step 1: Understand Your Application Requirements
Before you start throwing numbers around, you need to know what you're dealing with. How many users are we talking about? What's the expected response time? Are we building a simple CRUD app or the next TikTok?
Let's say you're building a social media app. You might have:
- 100 million monthly active users
- Peak usage during evening hours (let's say 20% of users online simultaneously)
- Each user makes 50 requests per session
- Target response time: under 200ms
Step 2: Measure Current Performance
If you have an existing system, load test it. Tools like Apache JMeter or Locust are your friends here. If you're starting from scratch, make educated guesses based on similar applications.
Let's assume your server can handle 2,000 requests per second (RPS) with acceptable response times.
Step 3: Calculate Peak Traffic
Here's where the math gets fun:
- Peak concurrent users: 100M × 0.2 = 20M users
- If each user makes 50 requests in a 30-minute session: 50 requests / 1800 seconds ≈ 0.028 RPS per user
- Total peak RPS: 20M × 0.028 = 560,000 RPS
Step 4: Apply Safety Margins
Never, and I mean NEVER, run your servers at 100% capacity. Apply a 20-30% safety margin. So if you need 560,000 RPS and each server handles 2,000 RPS:
Required servers = 560,000 / (2,000 × 0.7) = 400 servers
But wait, there's more to consider...
Peak Capacity Estimation Strategies
Peak capacity isn't just about normal traffic spikes. You need to think about:
Historical Data Analysis Look at your traffic patterns. Is there a seasonal spike during holidays? Do you get traffic surges during major events? Netflix probably sees massive spikes during new season releases.
Market Research and Growth Projections If you're launching something new, study similar platforms. How did Instagram's traffic grow in its first year? What about TikTok during the pandemic?
Event-Driven Spikes Planning a Super Bowl ad? Expecting to go viral on Reddit? Factor in those potential traffic explosions. I've seen startups get featured on Product Hunt and their servers just... die.

Load Testing: Your Reality Check
Load testing is where theory meets reality. You can calculate all you want, but until you actually stress-test your system, you're just guessing.
Define Realistic Test Scenarios Don't just test happy paths. Simulate:
- Gradual traffic increases
- Sudden traffic spikes
- Sustained high load
- Mixed workloads (reads vs writes)
Monitor Everything During load tests, watch:
- Response times (P95, P99 percentiles)
- Error rates
- CPU and memory utilization
- Database performance
- Network bandwidth
Popular Load Testing Tools:
- Apache JMeter (free, Java-based)
- Locust (Python-based, great for custom scenarios)
- Gatling (Scala-based, excellent reporting)
- Artillery (Node.js, good for APIs)
Autoscaling and Elastic Capacity
Here's where modern cloud architecture really shines. Instead of buying 400 servers and letting them sit idle most of the time, you can use autoscaling.
Autoscaling Strategies
Horizontal Scaling (Scale Out) Add more servers when demand increases. This is usually the way to go for web applications.
Vertical Scaling (Scale Up) Increase the power of existing servers. Good for databases and stateful applications.
Predictive Scaling Use machine learning to predict traffic patterns and scale proactively. AWS and Google Cloud offer this.
Implementation Tips
# Example autoscaling policy (pseudo-code)
if cpu_utilization > 70% for 5 minutes:
    add_instance()
elif cpu_utilization < 30% for 10 minutes:
    remove_instance()
Key Metrics for Autoscaling:
- CPU utilization
- Memory usage
- Request queue length
- Custom application metrics (like active user count)
Storage and Bandwidth for Large-Scale Systems
Data Storage Requirements
When you're dealing with large-scale systems, especially AI workloads, storage becomes a massive consideration.
Large Language Model Storage Needs:
Let's break down what a company like OpenAI might need for GPT-4:
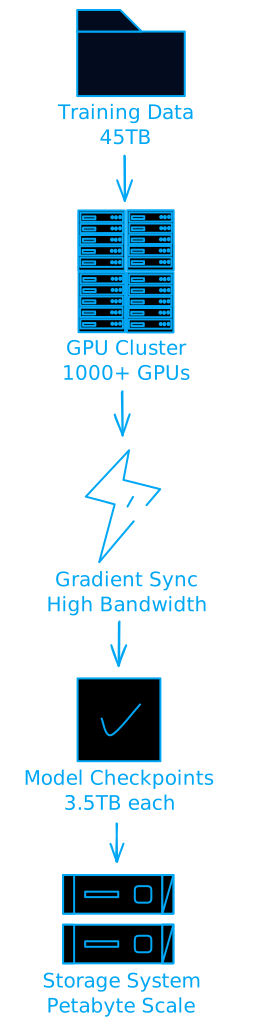
- Training dataset: ~45TB of text data
- Model parameters: ~1.76 trillion parameters × 2 bytes = ~3.5TB
- Checkpoints during training: 10-20 copies = ~35-70TB
- Gradient storage for distributed training: ~10-50TB
Total storage for one model training run: ~100-200TB
But that's just one model. Companies train multiple versions, experiment with different architectures, and keep historical data. We're talking petabytes here.
Bandwidth Requirements
Training large models requires insane bandwidth:
- Data loading: Streaming 45TB of training data efficiently
- Gradient synchronization: In distributed training with 1000 GPUs, you're synchronizing gradients constantly
- Checkpointing: Saving 3.5TB model states frequently
Real-world example: Training GPT-3 required about 314 zettaFLOPs of compute. The data movement alone for this would require sustained bandwidth in the hundreds of GB/s range.
Cost Optimization Strategies
Storage costs can kill your budget if you're not careful:
Data Lifecycle Management
- Hot data: Frequently accessed, expensive storage
- Warm data: Occasionally accessed, medium cost
- Cold data: Rarely accessed, cheap storage
- Archive: Long-term retention, very cheap
Compression and Deduplication Modern compression can reduce storage needs by 60-80% for text data.
Cloud vs On-Premises
- Cloud: Higher per-GB cost but elastic scaling
- On-premises: Lower per-GB cost but high upfront investment
Latency and Performance Optimization
Understanding Latency in Distributed Systems
Latency is the silent killer of user experience. Users expect sub-200ms response times for web applications and sub-100ms for real-time features.
Types of Latency:
- Network latency: Time for data to travel over the network
- Processing latency: Time for your application to process requests
- Database latency: Time for database queries
- Third-party API latency: Time for external service calls
Monitoring and Measurement
Key Metrics to Track:
- P50 (median): Half of requests are faster than this
- P95: 95% of requests are faster than this
- P99: 99% of requests are faster than this
- P99.9: The "long tail" that can ruin user experience
Tools for Latency Monitoring:
- Application Performance Monitoring (APM): New Relic, Datadog, AppDynamics
- Distributed tracing: Jaeger, Zipkin
- Real User Monitoring (RUM): Google Analytics, Pingdom
Latency Reduction Techniques
Content Delivery Networks (CDNs) Put your content closer to users. A CDN can reduce latency from 500ms to 50ms for global users.
Caching Strategies
- Browser caching: Cache static assets locally
- Application caching: Redis, Memcached for frequently accessed data
- Database caching: Query result caching
Protocol Optimization
- HTTP/2: Multiplexing, server push
- HTTP/3 (QUIC): Reduced connection establishment time
- WebSockets: For real-time communication
TCP vs UDP: The Latency Trade-off
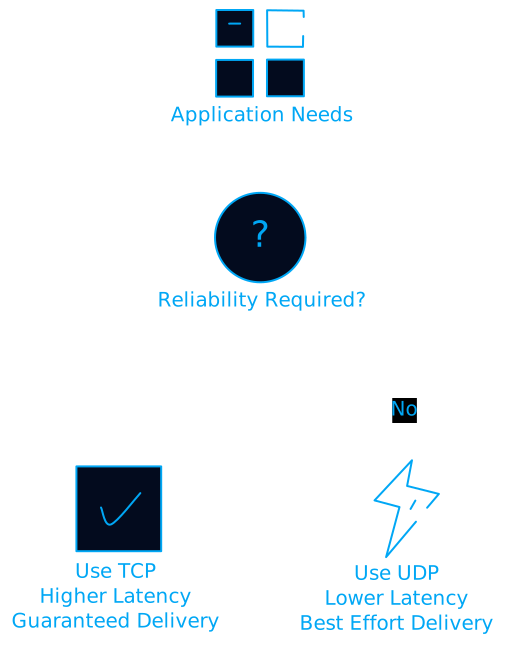
TCP (Transmission Control Protocol):
- Reliable delivery
- Connection-oriented
- Higher latency due to acknowledgments and retransmissions
- Good for: Web browsing, file transfers, APIs
UDP (User Datagram Protocol):
- Unreliable delivery
- Connectionless
- Lower latency
- Good for: Gaming, video streaming, real-time communication
Real-World Resource Estimation Examples
Let me walk you through some practical examples that you might encounter in interviews or real projects.
URL Shortener (like bit.ly)
Assumptions:
- 500M total users
- 1 new URL per user per month
- 100:1 read-to-write ratio
- 5-year data retention
Calculations:
Daily writes: 500M / 30 = 16.67M URLs/day
Daily reads: 16.67M × 100 = 1.67B reads/day
Peak RPS (assuming 10x daily average): 1.67B / 86400 × 10 = 193K RPS

Storage:
- Original URLs: 500M × 12 months × 5 years × 100 chars × 2 bytes = 6TB
- Short URLs: 30B × 7 chars × 2 bytes = 420GB
- Total: ~6.5TB
Infrastructure needs:
- 100-200 application servers (assuming 1K RPS per server)
- Distributed database (sharded by URL hash)
- CDN for global distribution
- Redis cluster for caching popular URLs
Social Media Platform (like Instagram)
Assumptions:
- 100M monthly active users
- 2 posts per user per day
- 2 media files per post (images/videos)
- 10-year retention
Calculations:
Daily posts: 100M × 2 = 200M posts/day
Daily reads (20:1 ratio): 200M × 20 = 4B reads/day

Storage (10 years):
- Text: 200M × 365 × 10 × 500 chars = 365TB
- Images: 200M × 365 × 10 × 2 × 500KB = 730PB
- Videos: 200M × 365 × 10 × 2 × 10MB = 14.6EB
This is where you realize why Instagram was sold to Facebook for $1B. The infrastructure costs alone are staggering.
Real-Time Messaging (like WhatsApp)
Assumptions:
- 100M monthly active users
- 20% online simultaneously
- 20 messages per user per day
- 1KB average message size
Calculations:
Concurrent connections: 100M × 0.2 = 20M connections
Daily messages: 100M × 20 = 2B messages/day
Peak message rate: 2B / 86400 × 10 = 231K messages/second

Storage (1 year): 2B × 365 × 1KB = 730TB
Special considerations:
- WebSocket connections for real-time delivery
- Message queues for offline users
- End-to-end encryption overhead
- Push notification infrastructure
Video Streaming Platform (like Netflix)
Assumptions:
- 50M monthly active users
- 2 hours of viewing per user per day
- 5 Mbps average bitrate (1080p)
- Multiple quality levels
Calculations:
Daily streaming: 50M × 2 hours × 5 Mbps = 500 PB/day
Peak bandwidth (assuming 3x average): 1.5 EB/day

Content storage:
- Original content: Assume 1 hour new content/day × 5 years = 9.125 PB
- Multiple encodings (4K, 1080p, 720p, 480p): 9.125 PB × 4 = 36.5 PB
Infrastructure needs:
- Massive CDN network (Netflix uses 15,000+ servers globally)
- Adaptive bitrate streaming
- Content encoding pipeline
- Recommendation engine infrastructure
Cost Considerations and Optimization
Cloud vs On-Premises Cost Analysis
Cloud Costs (AWS example):
- Compute: 3.00 per hour per instance
- Storage: 0.125 per GB per month
- Bandwidth: $0.09 per GB (outbound)
- Managed services: Premium pricing but reduced operational overhead
On-Premises Costs:
- Hardware: 50,000 per server (upfront)
- Power and cooling: 3,000 per server per year
- Maintenance: 15-20% of hardware cost annually
- Staff: $100,000+ per engineer per year
Cost Optimization Strategies
Right-Sizing Resources Don't over-provision. Use monitoring data to optimize instance sizes.
Reserved Instances and Savings Plans Commit to usage for 1-3 years for 30-60% discounts.
Spot Instances Use spare cloud capacity for 70-90% discounts (good for batch processing).
Auto-Scaling Scale down during low-traffic periods.
Data Transfer Optimization
- Use CDNs to reduce bandwidth costs
- Compress data
- Optimize API payloads
Advanced Considerations
But What About Edge Cases?
Real systems are messy. Here are some factors that can throw off your calculations:
Geographic Distribution Users aren't evenly distributed. 80% of your traffic might come from 20% of locations.
Seasonal Patterns E-commerce sites see 10x traffic during Black Friday. Dating apps spike on Valentine's Day.
Viral Content One viral post can bring down your entire system. Plan for 100x traffic spikes.
Bot Traffic Up to 40% of web traffic can be bots. Factor this into your calculations.
How Do You Handle Uncertainty?
Monte Carlo Simulations Instead of single-point estimates, use probability distributions.
Scenario Planning Plan for best case, worst case, and most likely scenarios.
Gradual Rollouts Launch to 1% of users, then 10%, then 100%. Measure and adjust.
What About AI and Machine Learning Workloads?
AI workloads are different beasts entirely:
Training vs Inference
- Training: Batch processing, high compute, predictable
- Inference: Real-time, variable load, latency-sensitive
GPU vs CPU
- GPUs: 10-100x faster for AI workloads but 5-10x more expensive
- TPUs: Google's custom chips, even faster for specific workloads
Model Serving Considerations
- Model size affects memory requirements
- Batch size affects throughput vs latency trade-offs
- A/B testing requires serving multiple models simultaneously
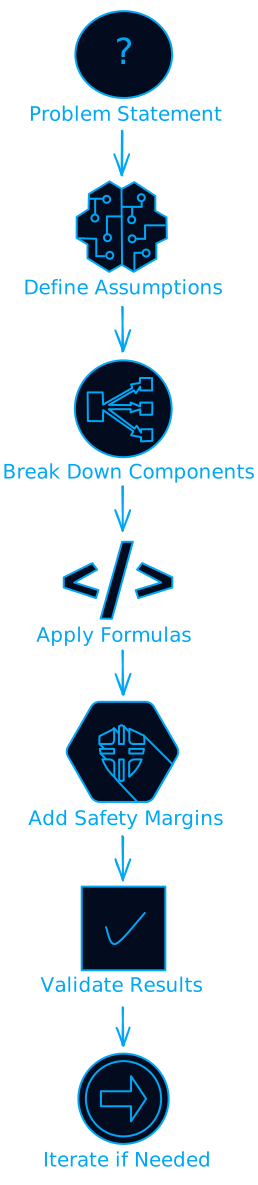
Putting It All Together: A Practical Framework
Here's my go-to framework for any resource estimation problem:
Step 1: Define the Problem Clearly
- What are we building?
- Who are the users?
- What are the key features?
- What are the performance requirements?
Step 2: Make Reasonable Assumptions
- Number of users (start with order of magnitude)
- Usage patterns (daily active users, session length)
- Data sizes (message length, image size, etc.)
- Growth rate
Step 3: Break Down the System
- Identify major components
- Estimate load for each component
- Consider data flow between components
Step 4: Calculate Resources
- Compute requirements (CPU, memory)
- Storage requirements (database, file storage)
- Network requirements (bandwidth, latency)
Step 5: Add Safety Margins
- 20-30% for normal operations
- 2-5x for peak loads
- 10x for viral scenarios
Step 6: Validate and Iterate
- Sanity check your numbers
- Compare with similar systems
- Adjust assumptions as needed

Common Pitfalls and How to Avoid Them
Pitfall 1: Ignoring the Data Model
Don't just think about requests per second. Think about data relationships, query patterns, and consistency requirements.
Pitfall 2: Underestimating Operational Overhead
Your application might handle 1000 RPS, but what about logging, monitoring, backups, and deployments?
Pitfall 3: Forgetting About Failure Scenarios
What happens when a server dies? A data center goes down? Plan for redundancy.
Pitfall 4: Linear Scaling Assumptions
Not everything scales linearly. Database joins get exponentially slower. Network effects can cause cascading failures.
Pitfall 5: Ignoring Geographic Distribution
Latency matters. A user in Australia accessing a server in Virginia will have a bad time.
Tools and Resources for Better Estimates
Calculation Tools
- Back-of-the-envelope calculator apps: Fermi, Guesstimate
- Cloud pricing calculators: AWS Calculator, Google Cloud Pricing Calculator
- Performance modeling tools: queueing theory calculators
Benchmarking Resources
- TPC benchmarks: Industry-standard database benchmarks
- Cloud provider documentation: Real-world performance numbers
- Open source projects: Study how others solve similar problems
Monitoring and Measurement
- Application Performance Monitoring: New Relic, Datadog, AppDynamics
- Infrastructure monitoring: Prometheus, Grafana, CloudWatch
- Load testing: JMeter, Locust, Artillery
The Future of Resource Estimation
Serverless and Function-as-a-Service
Traditional server calculations don't apply. Think in terms of:
- Function execution time
- Memory allocation
- Cold start frequency
- Concurrent executions
Edge Computing
Resources are distributed globally. Consider:
- Edge node capacity
- Data synchronization
- Failover strategies
AI-Powered Optimization
Machine learning is being used to:
- Predict traffic patterns
- Optimize resource allocation
- Detect anomalies
- Auto-tune performance
Wrapping Up: Your Next Steps
Back-of-the-envelope calculations aren't just for interviews. They're a fundamental skill for any engineer working on distributed systems. Here's how to get better:
- Practice regularly: Try estimating resources for apps you use daily
- Study real systems: Read engineering blogs from companies like Netflix, Uber, and Airbnb
- Build and measure: Nothing beats hands-on experience
- Stay updated: Technology changes fast, keep learning
Remember, the goal isn't to be perfectly accurate. It's to be roughly right rather than precisely wrong. These calculations help you make informed decisions, plan for scale, and avoid catastrophic failures.
The next time someone asks you how many servers Netflix needs, you won't freeze. You'll break out your mental calculator and show them exactly how to figure it out.
And who knows? Maybe you'll be the one designing the next system that needs to handle billions of requests per day. With these skills in your toolkit, you'll be ready for whatever scale throws at you.
Want to dive deeper into system design? Check out resources like "Designing Data-Intensive Applications" by Martin Kleppmann and practice with platforms like LeetCode's system design problems. The more you practice these calculations, the more intuitive they become.